

Regional and Latitudinal Resistance to Mixing in the Open Oceans
59
ACPC STCZ
SEC NECC NEC
NAC
0
20
15
10
5
0
20
25
30
15
10
5
0
20
25
30
35
15
10
5
0
50
100
150
200
250
40
39
38
37
36
35
34
33
50
40
30
20
10
0
–60
–40
–20
0
20
40
60
–60
–40
–20
0
20
40
60
–60
–40
–20
0
20
40
60
Depth of maximum values of N (m)
Maximum Brunt-Väisälä frequency
(N, cycles.h –1 )
Depth of N max
Value of N max
Surface salinity
Surface temperature (T°C)
T°C
Salinity
LATITUDE
Mixed layer silicate (µm)
Mixed layer nitrate (µm)
NO 3
SiO 3
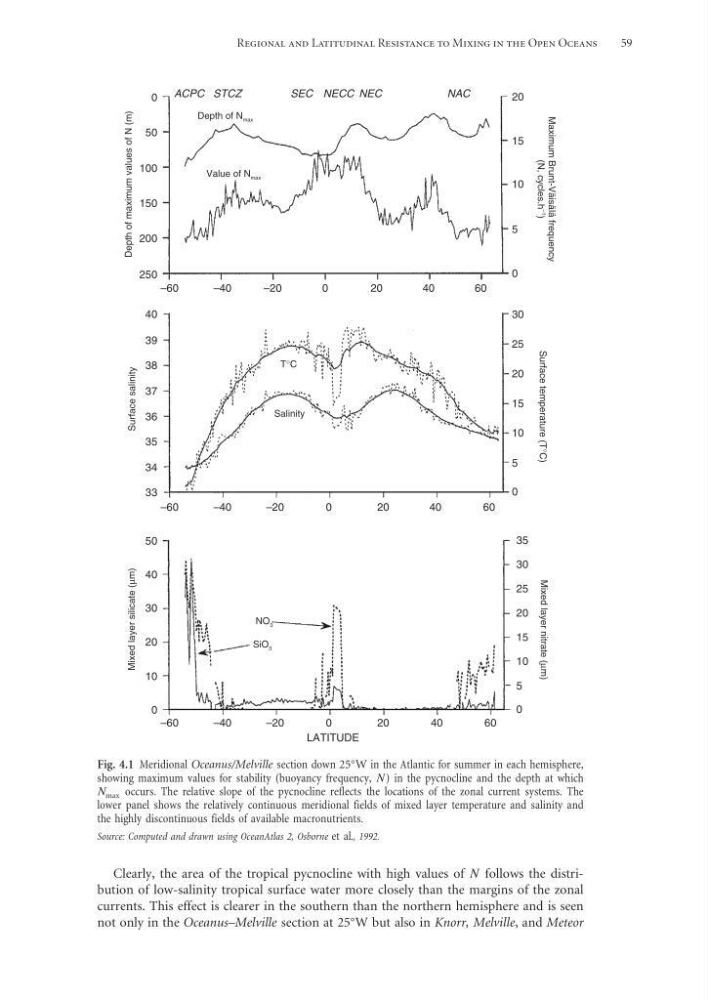
Fig. 4.1 Meridional Oceanus/Melville section down 25
W in the Atlantic for summer in each hemisphere,
showing maximum values for stability (buoyancy frequency, N ) in the pycnocline and the depth at which
N max occurs. The relative slope of the pycnocline reflects the locations of the zonal current systems. The
lower panel shows the relatively continuous meridional fields of mixed layer temperature and salinity and
the highly discontinuous fields of available macronutrients.
Source: Computed and drawn using OceanAtlas 2, Osborne et al., 1992.
Clearly, the area of the tropical pycnocline with high values of N follows the distribution of low-salinity tropical surface water more closely than the margins of the zonal
currents. This effect is clearer in the southern than the northern hemisphere and is seen
not only in the Oceanus–Melville section at 25
W but also in Knorr, Melville, and Meteor
59
ACPC STCZ
SEC NECC NEC
NAC
0
20
15
10
5
0
20
25
30
15
10
5
0
20
25
30
35
15
10
5
0
50
100
150
200
250
40
39
38
37
36
35
34
33
50
40
30
20
10
0
–60
–40
–20
0
20
40
60
–60
–40
–20
0
20
40
60
–60
–40
–20
0
20
40
60
Depth of maximum values of N (m)
Maximum Brunt-Väisälä frequency
(N, cycles.h –1 )
Depth of N max
Value of N max
Surface salinity
Surface temperature (T°C)
T°C
Salinity
LATITUDE
Mixed layer silicate (µm)
Mixed layer nitrate (µm)
NO 3
SiO 3
Fig. 4.1 Meridional Oceanus/Melville section down 25
W in the Atlantic for summer in each hemisphere,
showing maximum values for stability (buoyancy frequency, N ) in the pycnocline and the depth at which
N max occurs. The relative slope of the pycnocline reflects the locations of the zonal current systems. The
lower panel shows the relatively continuous meridional fields of mixed layer temperature and salinity and
the highly discontinuous fields of available macronutrients.
Source: Computed and drawn using OceanAtlas 2, Osborne et al., 1992.
Clearly, the area of the tropical pycnocline with high values of N follows the distribution of low-salinity tropical surface water more closely than the margins of the zonal
currents. This effect is clearer in the southern than the northern hemisphere and is seen
not only in the Oceanus–Melville section at 25
W but also in Knorr, Melville, and Meteor