

Recurrent, ENSO-Scale Changes of State
119
Great Famine of 1877 on the Indian subcontinent, meteorological observatories were
established there and undertook to monitor the strength and timing of the monsoon. In
the early years of the 20
th century, searching for an explanation of monsoon variability,
Gilbert Walker, then directing the Indian observatories, examined surface pressure records
across the Indo-Pacific. He uncovered a repetitive “Southern Oscillation” in the Pacificwide pressure field, and so gave us the critical tool to understand interannual change
in global weather patterns and ocean variability. Walker’s Southern Oscillation (SO)
refers to the observation that when atmospheric pressure is high over the Pacific Ocean
(the southeast Pacific subtropical high pressure cell) it is low over the Indian Ocean
(the Australian-Indonesian low-pressure trough) and vice versa. The state of the SO
is quantified by the SO Index (SOI), which, in its simplest form, is the differential
sea-level pressure between Darwin and Tahiti. It usually is computed as [dP(Tahiti) –
dP(Darwin)]/s.d., where dP represents the monthly pressure anomaly, as the monthly
mean minus the 1882–1997 mean.
The seesaw effect of the SOI has attracted a major research effort in recent decades
because it involves a great deal more of the global weather pattern than was at first
apparent. Low values of SOI, associated with a generalized weakening of the trade winds,
foreshadow events in the tropical Pacific that merit more than passing attention, though
for a deeper understanding of the physics involved the reader is referred to the nowabundant literature. My preferred starting point would be Tomczak and Godfrey (1994).
It is now customary to quantify the SOI into three phases keyed to sea surface temperature
in the eastern Pacific: (i) cool, with strong coastal upwelling off Peru, off California,
and at the equator, (ii) warm, when this upwelling weakens, and (iii) neutral, or the
intermediate condition. Traditionally, the warm phase was regarded as anomalous and
greeted in South America as El Niño, the Christ Child who came in winter. Somewhat
unnecessarily, oceanographers and meteorologists have coined the term La Niña for the
cool, upwelling periods when trade winds are at their most robust and sustained. Some
have attempted to classify El Niño events according to their duration of strength, but as
Philander (1990) reminds us, no two events are alike: there is no statutory Niño.
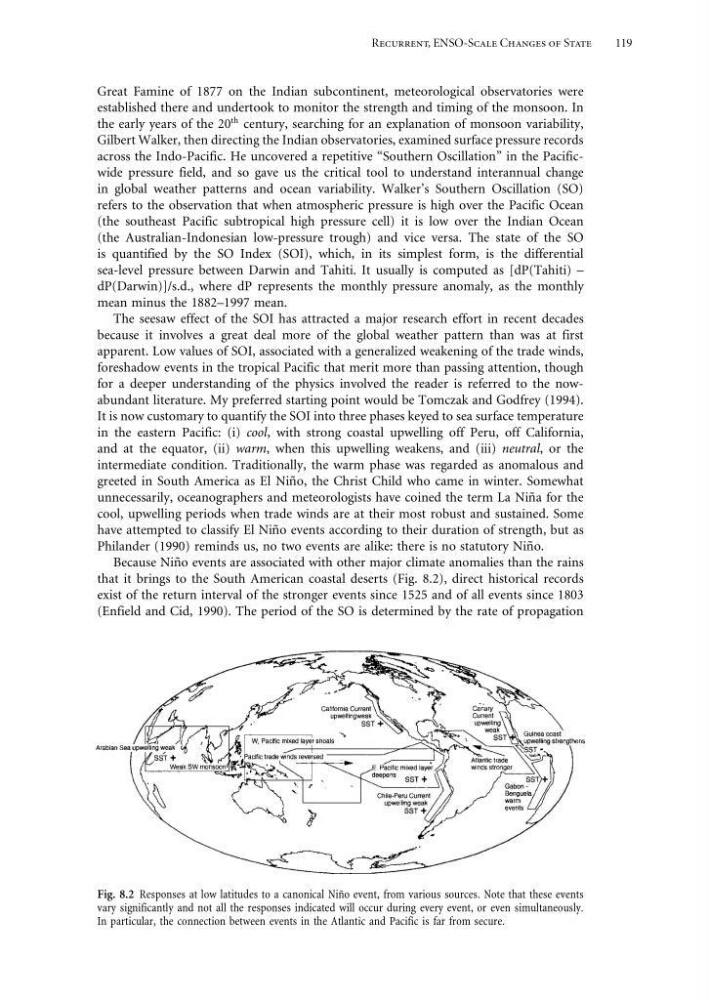
Because Niño events are associated with other major climate anomalies than the rains
that it brings to the South American coastal deserts (Fig. 8.2), direct historical records
exist of the return interval of the stronger events since 1525 and of all events since 1803
(Enfield and Cid, 1990). The period of the SO is determined by the rate of propagation
Fig. 8.2 Responses at low latitudes to a canonical Niño event, from various sources. Note that these events
vary significantly and not all the responses indicated will occur during every event, or even simultaneously.
In particular, the connection between events in the Atlantic and Pacific is far from secure.
119
Great Famine of 1877 on the Indian subcontinent, meteorological observatories were
established there and undertook to monitor the strength and timing of the monsoon. In
the early years of the 20
th century, searching for an explanation of monsoon variability,
Gilbert Walker, then directing the Indian observatories, examined surface pressure records
across the Indo-Pacific. He uncovered a repetitive “Southern Oscillation” in the Pacificwide pressure field, and so gave us the critical tool to understand interannual change
in global weather patterns and ocean variability. Walker’s Southern Oscillation (SO)
refers to the observation that when atmospheric pressure is high over the Pacific Ocean
(the southeast Pacific subtropical high pressure cell) it is low over the Indian Ocean
(the Australian-Indonesian low-pressure trough) and vice versa. The state of the SO
is quantified by the SO Index (SOI), which, in its simplest form, is the differential
sea-level pressure between Darwin and Tahiti. It usually is computed as [dP(Tahiti) –
dP(Darwin)]/s.d., where dP represents the monthly pressure anomaly, as the monthly
mean minus the 1882–1997 mean.
The seesaw effect of the SOI has attracted a major research effort in recent decades
because it involves a great deal more of the global weather pattern than was at first
apparent. Low values of SOI, associated with a generalized weakening of the trade winds,
foreshadow events in the tropical Pacific that merit more than passing attention, though
for a deeper understanding of the physics involved the reader is referred to the nowabundant literature. My preferred starting point would be Tomczak and Godfrey (1994).
It is now customary to quantify the SOI into three phases keyed to sea surface temperature
in the eastern Pacific: (i) cool, with strong coastal upwelling off Peru, off California,
and at the equator, (ii) warm, when this upwelling weakens, and (iii) neutral, or the
intermediate condition. Traditionally, the warm phase was regarded as anomalous and
greeted in South America as El Niño, the Christ Child who came in winter. Somewhat
unnecessarily, oceanographers and meteorologists have coined the term La Niña for the
cool, upwelling periods when trade winds are at their most robust and sustained. Some
have attempted to classify El Niño events according to their duration of strength, but as
Philander (1990) reminds us, no two events are alike: there is no statutory Niño.
Because Niño events are associated with other major climate anomalies than the rains
that it brings to the South American coastal deserts (Fig. 8.2), direct historical records
exist of the return interval of the stronger events since 1525 and of all events since 1803
(Enfield and Cid, 1990). The period of the SO is determined by the rate of propagation
Fig. 8.2 Responses at low latitudes to a canonical Niño event, from various sources. Note that these events
vary significantly and not all the responses indicated will occur during every event, or even simultaneously.
In particular, the connection between events in the Atlantic and Pacific is far from secure.