

118
Chapter 8: Longer Term Responses: From Seasons to Centuries
-3
-2
-1
0
1
2
3
Southern Oscillation Index
Monthly values from 1950 to 2005
1956
1958
1964
1972
1973
1982
1987
1996
1998
1991
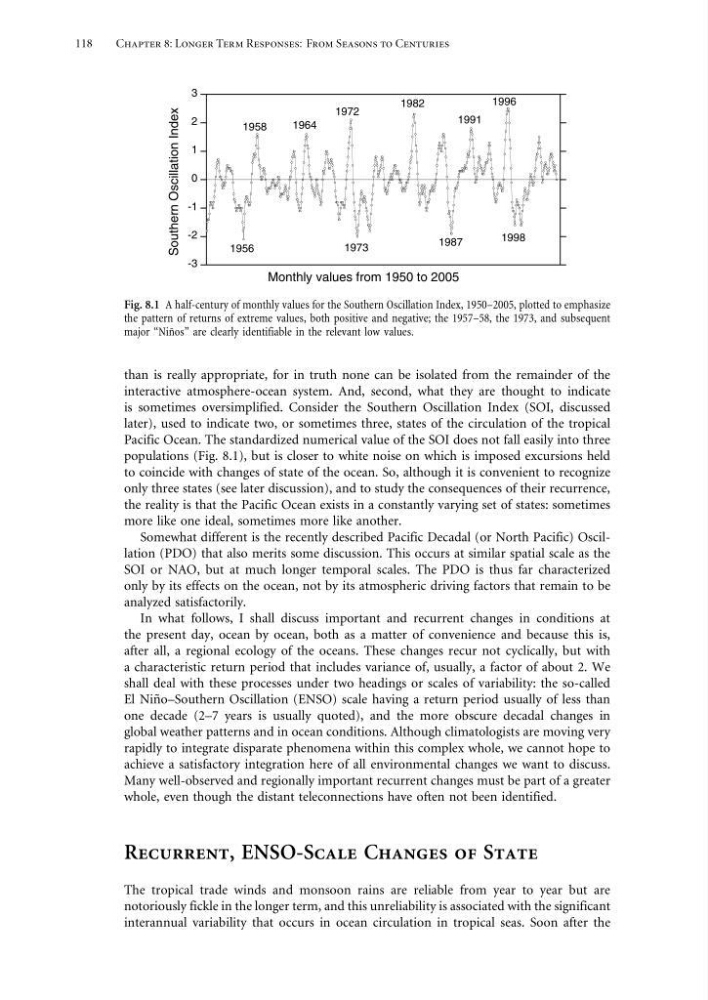
Fig. 8.1 A half-century of monthly values for the Southern Oscillation Index, 1950–2005, plotted to emphasize
the pattern of returns of extreme values, both positive and negative; the 1957–58, the 1973, and subsequent
major “Niños” are clearly identifiable in the relevant low values.
than is really appropriate, for in truth none can be isolated from the remainder of the
interactive atmosphere-ocean system. And, second, what they are thought to indicate
is sometimes oversimplified. Consider the Southern Oscillation Index (SOI, discussed
later), used to indicate two, or sometimes three, states of the circulation of the tropical
Pacific Ocean. The standardized numerical value of the SOI does not fall easily into three
populations (Fig. 8.1), but is closer to white noise on which is imposed excursions held
to coincide with changes of state of the ocean. So, although it is convenient to recognize
only three states (see later discussion), and to study the consequences of their recurrence,
the reality is that the Pacific Ocean exists in a constantly varying set of states: sometimes
more like one ideal, sometimes more like another.
Somewhat different is the recently described Pacific Decadal (or North Pacific) Oscillation (PDO) that also merits some discussion. This occurs at similar spatial scale as the
SOI or NAO, but at much longer temporal scales. The PDO is thus far characterized
only by its effects on the ocean, not by its atmospheric driving factors that remain to be
analyzed satisfactorily.
In what follows, I shall discuss important and recurrent changes in conditions at
the present day, ocean by ocean, both as a matter of convenience and because this is,
after all, a regional ecology of the oceans. These changes recur not cyclically, but with
a characteristic return period that includes variance of, usually, a factor of about 2. We
shall deal with these processes under two headings or scales of variability: the so-called
El Niño–Southern Oscillation (ENSO) scale having a return period usually of less than
one decade (2–7 years is usually quoted), and the more obscure decadal changes in
global weather patterns and in ocean conditions. Although climatologists are moving very
rapidly to integrate disparate phenomena within this complex whole, we cannot hope to
achieve a satisfactory integration here of all environmental changes we want to discuss.
Many well-observed and regionally important recurrent changes must be part of a greater
whole, even though the distant teleconnections have often not been identified.
Recurrent, ENSO-Scale Changes of State
The tropical trade winds and monsoon rains are reliable from year to year but are
notoriously fickle in the longer term, and this unreliability is associated with the significant
interannual variability that occurs in ocean circulation in tropical seas. Soon after the
Chapter 8: Longer Term Responses: From Seasons to Centuries
-3
-2
-1
0
1
2
3
Southern Oscillation Index
Monthly values from 1950 to 2005
1956
1958
1964
1972
1973
1982
1987
1996
1998
1991
Fig. 8.1 A half-century of monthly values for the Southern Oscillation Index, 1950–2005, plotted to emphasize
the pattern of returns of extreme values, both positive and negative; the 1957–58, the 1973, and subsequent
major “Niños” are clearly identifiable in the relevant low values.
than is really appropriate, for in truth none can be isolated from the remainder of the
interactive atmosphere-ocean system. And, second, what they are thought to indicate
is sometimes oversimplified. Consider the Southern Oscillation Index (SOI, discussed
later), used to indicate two, or sometimes three, states of the circulation of the tropical
Pacific Ocean. The standardized numerical value of the SOI does not fall easily into three
populations (Fig. 8.1), but is closer to white noise on which is imposed excursions held
to coincide with changes of state of the ocean. So, although it is convenient to recognize
only three states (see later discussion), and to study the consequences of their recurrence,
the reality is that the Pacific Ocean exists in a constantly varying set of states: sometimes
more like one ideal, sometimes more like another.
Somewhat different is the recently described Pacific Decadal (or North Pacific) Oscillation (PDO) that also merits some discussion. This occurs at similar spatial scale as the
SOI or NAO, but at much longer temporal scales. The PDO is thus far characterized
only by its effects on the ocean, not by its atmospheric driving factors that remain to be
analyzed satisfactorily.
In what follows, I shall discuss important and recurrent changes in conditions at
the present day, ocean by ocean, both as a matter of convenience and because this is,
after all, a regional ecology of the oceans. These changes recur not cyclically, but with
a characteristic return period that includes variance of, usually, a factor of about 2. We
shall deal with these processes under two headings or scales of variability: the so-called
El Niño–Southern Oscillation (ENSO) scale having a return period usually of less than
one decade (2–7 years is usually quoted), and the more obscure decadal changes in
global weather patterns and in ocean conditions. Although climatologists are moving very
rapidly to integrate disparate phenomena within this complex whole, we cannot hope to
achieve a satisfactory integration here of all environmental changes we want to discuss.
Many well-observed and regionally important recurrent changes must be part of a greater
whole, even though the distant teleconnections have often not been identified.
Recurrent, ENSO-Scale Changes of State
The tropical trade winds and monsoon rains are reliable from year to year but are
notoriously fickle in the longer term, and this unreliability is associated with the significant
interannual variability that occurs in ocean circulation in tropical seas. Soon after the