

the revenue that the license fees and other fees like social security, crew role, . . . etc would
have brought in if considered artisanal (1,200 USD per vessel) and the license fees that they
bring as they are considered recreational (30 USD) [20], knowing that most recreational catch
is sold in local markets (pers. observation.). The difference represents a nontaxable income to
local recreational fishers.
Hence, the total revenue earned by recreational fishers is calculated as the discount on the
cost of the license and other fees, i.e. the difference between the cost of a full commercial
license (1,200USD)–noting that vessel size is similar, and geographic fishing range, and fishing
capacity are similar–and that of a recreational license (30 USD), plus the revenue from the
catch itself (or landed value).
The operating costs (fuel and lubricant) are deduced from the total revenue, on the basis of
an average number of trips of 73 days per year multiplied by a cost estimated at 2,300 DA by
trip, according to small scale fishers with whom we conversed.
Hence, the total operating cost is estimated as the cost per day, multiplied by the number of
trips (fishing days), multiplied by the number of licenses (which reflects the number of boats,
as one boat gets one license). Therefore, profits from the recreational sector gained by fishers,
are estimated as the total revenue i.e. average ex-cessel price multiplied by the catch per year,
plus the value they would otherwise pay if they were considered professional (i.e. lost to government), minus the operating costs.
The ex-vessel price is estimated at 675 AD (Algerian Dinar) in 2015 ($1 US = 100 AD) as
extracted from the Algerian National Fisheries Database (Government of Algeria, unpub. data).
Results
Recreational vessels catch
The recreational landing is estimated at 3, 256.28 kgÁvessel
-1
Áyear
-1
.The reconstructed catch
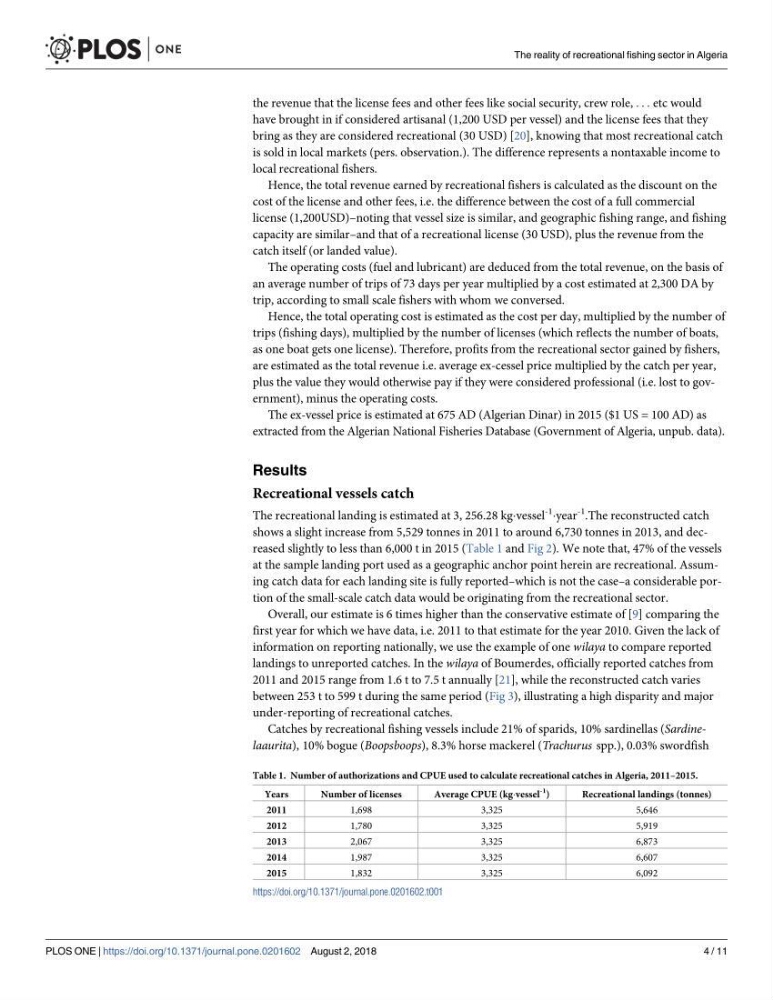
shows a slight increase from 5,529 tonnes in 2011 to around 6,730 tonnes in 2013, and decreased slightly to less than 6,000 t in 2015 (Table 1 and Fig 2). We note that, 47% of the vessels
at the sample landing port used as a geographic anchor point herein are recreational. Assuming catch data for each landing site is fully reported–which is not the case–a considerable portion of the small-scale catch data would be originating from the recreational sector.
Overall, our estimate is 6 times higher than the conservative estimate of [9] comparing the
first year for which we have data, i.e. 2011 to that estimate for the year 2010. Given the lack of
information on reporting nationally, we use the example of one wilaya to compare reported
landings to unreported catches. In the wilaya of Boumerdes, officially reported catches from
2011 and 2015 range from 1.6 t to 7.5 t annually [21], while the reconstructed catch varies
between 253 t to 599 t during the same period (Fig 3), illustrating a high disparity and major
under-reporting of recreational catches.
Catches by recreational fishing vessels include 21% of sparids, 10% sardinellas (Sardinelaaurita), 10% bogue (Boopsboops), 8.3% horse mackerel (Trachurus spp.), 0.03% swordfish
Table 1. Number of authorizations and CPUE used to calculate recreational catches in Algeria, 2011–2015.
Years
Number of licenses
Average CPUE (kgÁvessel
-1
)
Recreational landings (tonnes)
2011
1,698
3,325
5,646
2012
1,780
3,325
5,919
2013
2,067
3,325
6,873
2014
1,987
3,325
6,607
2015
1,832
3,325
6,092
https://doi.org/10.1371/journal.pone.0201602.t001
The reality of recreational fishing sector in Algeria
PLOS ONE | https://doi.org/10.1371/journal.pone.0201602 August 2, 2018
4 / 11
have brought in if considered artisanal (1,200 USD per vessel) and the license fees that they
bring as they are considered recreational (30 USD) [20], knowing that most recreational catch
is sold in local markets (pers. observation.). The difference represents a nontaxable income to
local recreational fishers.
Hence, the total revenue earned by recreational fishers is calculated as the discount on the
cost of the license and other fees, i.e. the difference between the cost of a full commercial
license (1,200USD)–noting that vessel size is similar, and geographic fishing range, and fishing
capacity are similar–and that of a recreational license (30 USD), plus the revenue from the
catch itself (or landed value).
The operating costs (fuel and lubricant) are deduced from the total revenue, on the basis of
an average number of trips of 73 days per year multiplied by a cost estimated at 2,300 DA by
trip, according to small scale fishers with whom we conversed.
Hence, the total operating cost is estimated as the cost per day, multiplied by the number of
trips (fishing days), multiplied by the number of licenses (which reflects the number of boats,
as one boat gets one license). Therefore, profits from the recreational sector gained by fishers,
are estimated as the total revenue i.e. average ex-cessel price multiplied by the catch per year,
plus the value they would otherwise pay if they were considered professional (i.e. lost to government), minus the operating costs.
The ex-vessel price is estimated at 675 AD (Algerian Dinar) in 2015 ($1 US = 100 AD) as
extracted from the Algerian National Fisheries Database (Government of Algeria, unpub. data).
Results
Recreational vessels catch
The recreational landing is estimated at 3, 256.28 kgÁvessel
-1
Áyear
-1
.The reconstructed catch
shows a slight increase from 5,529 tonnes in 2011 to around 6,730 tonnes in 2013, and decreased slightly to less than 6,000 t in 2015 (Table 1 and Fig 2). We note that, 47% of the vessels
at the sample landing port used as a geographic anchor point herein are recreational. Assuming catch data for each landing site is fully reported–which is not the case–a considerable portion of the small-scale catch data would be originating from the recreational sector.
Overall, our estimate is 6 times higher than the conservative estimate of [9] comparing the
first year for which we have data, i.e. 2011 to that estimate for the year 2010. Given the lack of
information on reporting nationally, we use the example of one wilaya to compare reported
landings to unreported catches. In the wilaya of Boumerdes, officially reported catches from
2011 and 2015 range from 1.6 t to 7.5 t annually [21], while the reconstructed catch varies
between 253 t to 599 t during the same period (Fig 3), illustrating a high disparity and major
under-reporting of recreational catches.
Catches by recreational fishing vessels include 21% of sparids, 10% sardinellas (Sardinelaaurita), 10% bogue (Boopsboops), 8.3% horse mackerel (Trachurus spp.), 0.03% swordfish
Table 1. Number of authorizations and CPUE used to calculate recreational catches in Algeria, 2011–2015.
Years
Number of licenses
Average CPUE (kgÁvessel
-1
)
Recreational landings (tonnes)
2011
1,698
3,325
5,646
2012
1,780
3,325
5,919
2013
2,067
3,325
6,873
2014
1,987
3,325
6,607
2015
1,832
3,325
6,092
https://doi.org/10.1371/journal.pone.0201602.t001
The reality of recreational fishing sector in Algeria
PLOS ONE | https://doi.org/10.1371/journal.pone.0201602 August 2, 2018
4 / 11