

4
t 0 = -0.39 1 2 3 4 5 6 7 8 9 10 11 12 13
Age (years)
L ∞
32.8
30
25
20
15
10
5
TL (cm)
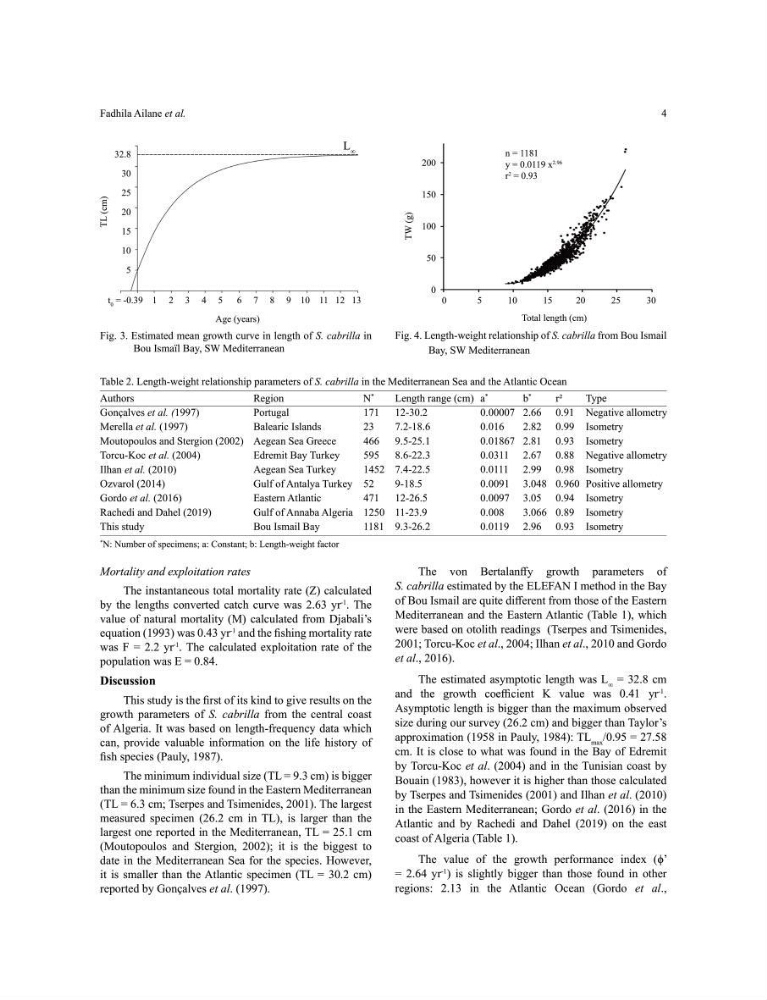
Fig. 3. Estimated mean growth curve in length of S. cabrilla in
Bou Ismaïl Bay, SW Mediterranean
Table 2. Length-weight relationship parameters of S. cabrilla in the Mediterranean Sea and the Atlantic Ocean
Authors
Region
N
*
Length range (cm) a
*
b
*
r²
Type
Gonçalves et al. (1997)
Portugal
171 12-30.2
0.00007 2.66 0.91 Negative allometry
Merella et al. (1997)
Balearic Islands
23
7.2-18.6
0.016
2.82 0.99 Isometry
Moutopoulos and Stergion (2002) Aegean Sea Greece
466 9.5-25.1
0.01867 2.81 0.93 Isometry
Torcu-Koc et al. (2004)
Edremit Bay Turkey
595 8.6-22.3
0.0311 2.67 0.88 Negative allometry
Ilhan et al. (2010)
Aegean Sea Turkey
1452 7.4-22.5
0.0111 2.99 0.98 Isometry
Ozvarol (2014)
Gulf of Antalya Turkey 52
9-18.5
0.0091 3.048 0.960 Positive allometry
Gordo et al. (2016)
Eastern Atlantic
471 12-26.5
0.0097 3.05 0.94 Isometry
Rachedi and Dahel (2019)
Gulf of Annaba Algeria 1250 11-23.9
0.008
3.066 0.89 Isometry
This study
Bou Ismail Bay
1181 9.3-26.2
0.0119 2.96 0.93 Isometry
*
N: Number of specimens; a: Constant; b: Length-weight factor
0
5
10
15
20
25
30
Total length (cm)
200
150
100
50
0
TW (g)
n = 1181
y = 0.0119 x
2.96
r
2
= 0.93
Fig. 4. Length-weight relationship of S. cabrilla from Bou Ismail
Bay, SW Mediterranean
Mortality and exploitation rates
The instantaneous total mortality rate (Z) calculated
by the lengths converted catch curve was 2.63 yr
-1
. The
value of natural mortality (M) calculated from Djabali’s
equation (1993) was 0.43 yr
-1
and the fishing mortality rate
was F = 2.2 yr
-1
. The calculated exploitation rate of the
population was E = 0.84.
Discussion
This study is the first of its kind to give results on the
growth parameters of S. cabrilla from the central coast
of Algeria. It was based on length-frequency data which
can, provide valuable information on the life history of
fish species (Pauly, 1987).
The minimum individual size (TL = 9.3 cm) is bigger
than the minimum size found in the Eastern Mediterranean
(TL = 6.3 cm; Tserpes and Tsimenides, 2001). The largest
measured specimen (26.2 cm in TL), is larger than the
largest one reported in the Mediterranean, TL = 25.1 cm
(Moutopoulos and Stergion, 2002); it is the biggest to
date in the Mediterranean Sea for the species. However,
it is smaller than the Atlantic specimen (TL = 30.2 cm)
reported by Gonçalves et al. (1997).
The von Bertalanffy growth parameters of
S. cabrilla estimated by the ELEFAN I method in the Bay
of Bou Ismail are quite different from those of the Eastern
Mediterranean and the Eastern Atlantic (Table 1), which
were based on otolith readings (Tserpes and Tsimenides,
2001; Torcu-Koc et al., 2004; Ilhan et al., 2010 and Gordo
et al., 2016).
The estimated asymptotic length was L ∞ = 32.8 cm
and the growth coefficient K value was 0.41 yr
-1
.
Asymptotic length is bigger than the maximum observed
size during our survey (26.2 cm) and bigger than Taylor’s
approximation (1958 in Pauly, 1984): TL max /0.95 = 27.58
cm. It is close to what was found in the Bay of Edremit
by Torcu-Koc et al. (2004) and in the Tunisian coast by
Bouain (1983), however it is higher than those calculated
by Tserpes and Tsimenides (2001) and Ilhan et al. (2010)
in the Eastern Mediterranean; Gordo et al. (2016) in the
Atlantic and by Rachedi and Dahel (2019) on the east
coast of Algeria (Table 1).
The value of the growth performance index (ϕ’
= 2.64 yr
-1
) is slightly bigger than those found in other
regions: 2.13 in the Atlantic Ocean (Gordo et al.,
Fadhila Ailane et al.
t 0 = -0.39 1 2 3 4 5 6 7 8 9 10 11 12 13
Age (years)
L ∞
32.8
30
25
20
15
10
5
TL (cm)
Fig. 3. Estimated mean growth curve in length of S. cabrilla in
Bou Ismaïl Bay, SW Mediterranean
Table 2. Length-weight relationship parameters of S. cabrilla in the Mediterranean Sea and the Atlantic Ocean
Authors
Region
N
*
Length range (cm) a
*
b
*
r²
Type
Gonçalves et al. (1997)
Portugal
171 12-30.2
0.00007 2.66 0.91 Negative allometry
Merella et al. (1997)
Balearic Islands
23
7.2-18.6
0.016
2.82 0.99 Isometry
Moutopoulos and Stergion (2002) Aegean Sea Greece
466 9.5-25.1
0.01867 2.81 0.93 Isometry
Torcu-Koc et al. (2004)
Edremit Bay Turkey
595 8.6-22.3
0.0311 2.67 0.88 Negative allometry
Ilhan et al. (2010)
Aegean Sea Turkey
1452 7.4-22.5
0.0111 2.99 0.98 Isometry
Ozvarol (2014)
Gulf of Antalya Turkey 52
9-18.5
0.0091 3.048 0.960 Positive allometry
Gordo et al. (2016)
Eastern Atlantic
471 12-26.5
0.0097 3.05 0.94 Isometry
Rachedi and Dahel (2019)
Gulf of Annaba Algeria 1250 11-23.9
0.008
3.066 0.89 Isometry
This study
Bou Ismail Bay
1181 9.3-26.2
0.0119 2.96 0.93 Isometry
*
N: Number of specimens; a: Constant; b: Length-weight factor
0
5
10
15
20
25
30
Total length (cm)
200
150
100
50
0
TW (g)
n = 1181
y = 0.0119 x
2.96
r
2
= 0.93
Fig. 4. Length-weight relationship of S. cabrilla from Bou Ismail
Bay, SW Mediterranean
Mortality and exploitation rates
The instantaneous total mortality rate (Z) calculated
by the lengths converted catch curve was 2.63 yr
-1
. The
value of natural mortality (M) calculated from Djabali’s
equation (1993) was 0.43 yr
-1
and the fishing mortality rate
was F = 2.2 yr
-1
. The calculated exploitation rate of the
population was E = 0.84.
Discussion
This study is the first of its kind to give results on the
growth parameters of S. cabrilla from the central coast
of Algeria. It was based on length-frequency data which
can, provide valuable information on the life history of
fish species (Pauly, 1987).
The minimum individual size (TL = 9.3 cm) is bigger
than the minimum size found in the Eastern Mediterranean
(TL = 6.3 cm; Tserpes and Tsimenides, 2001). The largest
measured specimen (26.2 cm in TL), is larger than the
largest one reported in the Mediterranean, TL = 25.1 cm
(Moutopoulos and Stergion, 2002); it is the biggest to
date in the Mediterranean Sea for the species. However,
it is smaller than the Atlantic specimen (TL = 30.2 cm)
reported by Gonçalves et al. (1997).
The von Bertalanffy growth parameters of
S. cabrilla estimated by the ELEFAN I method in the Bay
of Bou Ismail are quite different from those of the Eastern
Mediterranean and the Eastern Atlantic (Table 1), which
were based on otolith readings (Tserpes and Tsimenides,
2001; Torcu-Koc et al., 2004; Ilhan et al., 2010 and Gordo
et al., 2016).
The estimated asymptotic length was L ∞ = 32.8 cm
and the growth coefficient K value was 0.41 yr
-1
.
Asymptotic length is bigger than the maximum observed
size during our survey (26.2 cm) and bigger than Taylor’s
approximation (1958 in Pauly, 1984): TL max /0.95 = 27.58
cm. It is close to what was found in the Bay of Edremit
by Torcu-Koc et al. (2004) and in the Tunisian coast by
Bouain (1983), however it is higher than those calculated
by Tserpes and Tsimenides (2001) and Ilhan et al. (2010)
in the Eastern Mediterranean; Gordo et al. (2016) in the
Atlantic and by Rachedi and Dahel (2019) on the east
coast of Algeria (Table 1).
The value of the growth performance index (ϕ’
= 2.64 yr
-1
) is slightly bigger than those found in other
regions: 2.13 in the Atlantic Ocean (Gordo et al.,
Fadhila Ailane et al.