

Groundwater for Sustainable Development 11 (2020) 100481
4
33
◦
C in summer (July and August) for the period from 1998 to 2015
according to the National Water Resources Agency (Khadidja, 2018).
The coastal area is more humid compared to the rest of the territory, due
to its exposure to maritime flows. This precipitation is abundant,
irregular and unequally distributed, sometimes very severe depending
on the month or the years, varying from 370.12 mm/year to 714.79
mm/year with an average of 573.68 mm/year for the period 2000 to
2015 (ANRH in Khadidja, 2018). The seasonal distribution of rainfall is
about 43% in winter, 28% in autumn, 27.5% in spring and only 1.5% in
summer (ANRH in Khadidja, 2018).
The Cherchell region is part of the large Algiers coastal watershed,
more precisely the West Algeries Coast, in the Cherchell coastal subwatershed (02–03), according to the Algiers ANRH code (ANRH in
Khadidja, 2018). Oued El Hachem originates in the mounts of djebel
Boumaad at about 1400 m of altitude, takes a submeridian direction
(S–N), it has a watershed with a surface area of 224 Km
2
and a perimeter
of 80 Km and a length of about 39 Km. This wadi crosses the Cherchell
Plain and flows into the sea, including the downstream part of the
aquifer at Hamdania Beach.
The Boukourdene dam is situated at an altitude of 74 m, implanted in
1992, on the bed of El Hachem wadi, 11 km south of the Cherchell
coastline and 3 km from the upstream limit of the Cherchell aquifer. It
receives rainwater from the watershed, 20 hm
3
/year of water and 0.21
hm
3
/year of sediment (Tadrist et al., 2016), but its water capacity is 80
hm
3
. The water depth is 102 m, but the total dam height is 123 m
(Tadrist et al., 2016).
4. Data and methods
The method that addresses the need for the study is based on the
GALDIT model destineted for coastal aquifers. It was first developed
during the “EU- India INCO-DEV COASTIN” project (Mahrez et al.,
2018), whose objective was to determine the vulnerability of coastal
aquifers to marine intrusion by (Chachadi and Lobo-Ferreira, 2001a,b)
and improved by the same authors in 2005. The main condition for
application of the GALDIT method is that the bottom of the aquifer(s) is
below the mean sea level (Chachadi, 2005). This method is based on
hydrogeological, hydrological and geomorphological characteristics of
the aquifer studied (Chachadi and Lobo-Ferreira, 2001a,b; Chachadi
et al., 2003; Chachadi and Lobo Ferreira, 2007). This method is a
mapping approach, simple to use, represent measurable parameters for
which data are generally available from various sources without
detailed knowledge, serve to map the parts of an aquifer most vulnerable
to marine intrusion, and represent a basic tool for local managers and
decision-makers for future decisions to manage and protect an aquifer
from marine intrusion, which has motivated many researchers around
the world to follow this method for the development of their work
(Guezgouz n and Bouhsina; Niazi, 2007; Najib et al., 2012; Batchi et al.,
2014; Bouderbala et al., 2016; Trabelsi et al. 2016; Djoudar et al., 2017;
Boudjelil and Djafari, 2018; Kazakis et al., 2018; Mahrez et al., 2018;
Djabri et al., 2019). The different parameters requiried in the GALDIT
model and the data used to map each GALDIT parameter for the Cherchell aquifer are as follows:
- Parameter G (Groundwater occurrence); groundwater is found in
geological strata, either confined, unconfined or semi confined. The
Cherchell aquifer is unconfined in the south between Zouriche and
Bouaroua, and confined in the north (Mancet, 1972).
- Parameter A (Aquifer hydraulic conductivity); is the permeability
of a soil or rock to water under the effect of a hydraulic gradient
(Castany 1982a, 1982b). The higher the hydraulic conductivity
facing the sea, the higher the risk of marine intrusion.
The hydraulic conductivity of an aquifer is the ratio between transmissivity and thickness of aquifer (Mahrez et al., 2018).
K =
T
b
K: Hydraulic conductivity (m/day);
T: Aquifer transmissivity (m
2
/day);
b: Aquifer thickness (m).
The hydraulic conductivity calculated for the Cherchell aquifer
varies between 10 and 22 m/day.
- Parameter L (Depth to groundwater level above sea); is a very
important factor in assessing the marine intrusion of a coastal aquifer
because it determines the hydraulic pressure available to move the
seafront. As the piezometric level decreases and reaches its minimum
levels above sea level, vulnerability to marine intrusion increases.
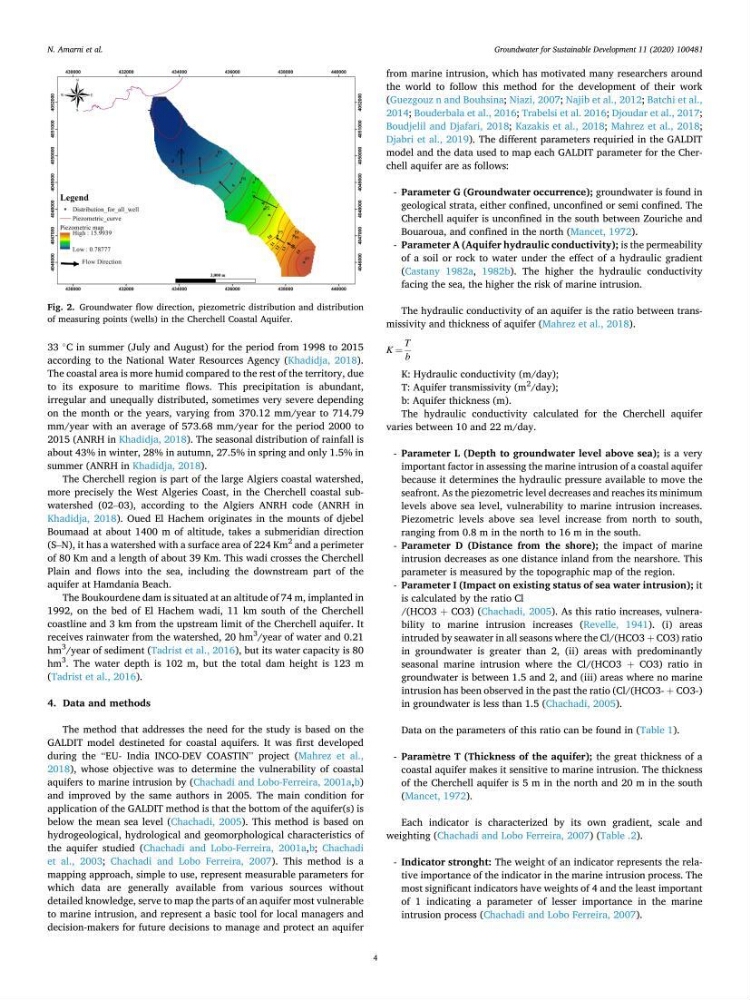
Piezometric levels above sea level increase from north to south,
ranging from 0.8 m in the north to 16 m in the south.
- Parameter D (Distance from the shore); the impact of marine
intrusion decreases as one distance inland from the nearshore. This
parameter is measured by the topographic map of the region.
- Parameter I (Impact on existing status of sea water intrusion); it
is calculated by the ratio Cl
/(HCO3 + CO3) (Chachadi, 2005). As this ratio increases, vulnerability to marine intrusion increases (Revelle, 1941). (i) areas
intruded by seawater in all seasons where the Cl/(HCO3 + CO3) ratio
in groundwater is greater than 2, (ii) areas with predominantly
seasonal marine intrusion where the Cl/(HCO3 + CO3) ratio in
groundwater is between 1.5 and 2, and (iii) areas where no marine
intrusion has been observed in the past the ratio (Cl/(HCO3- + CO3-)
in groundwater is less than 1.5 (Chachadi, 2005).
Data on the parameters of this ratio can be found in (Table 1).
- Param` etre T (Thickness of the aquifer); the great thickness of a
coastal aquifer makes it sensitive to marine intrusion. The thickness
of the Cherchell aquifer is 5 m in the north and 20 m in the south
(Mancet, 1972).
Each indicator is characterized by its own gradient, scale and
weighting (Chachadi and Lobo Ferreira, 2007) (Table .2).
- Indicator stronght: The weight of an indicator represents the relative importance of the indicator in the marine intrusion process. The
most significant indicators have weights of 4 and the least important
of 1 indicating a parameter of lesser importance in the marine
intrusion process (Chachadi and Lobo Ferreira, 2007).
Fig. 2. Groundwater flow direction, piezometric distribution and distribution
of measuring points (wells) in the Cherchell Coastal Aquifer.
N. Amarni et al.
4
33
◦
C in summer (July and August) for the period from 1998 to 2015
according to the National Water Resources Agency (Khadidja, 2018).
The coastal area is more humid compared to the rest of the territory, due
to its exposure to maritime flows. This precipitation is abundant,
irregular and unequally distributed, sometimes very severe depending
on the month or the years, varying from 370.12 mm/year to 714.79
mm/year with an average of 573.68 mm/year for the period 2000 to
2015 (ANRH in Khadidja, 2018). The seasonal distribution of rainfall is
about 43% in winter, 28% in autumn, 27.5% in spring and only 1.5% in
summer (ANRH in Khadidja, 2018).
The Cherchell region is part of the large Algiers coastal watershed,
more precisely the West Algeries Coast, in the Cherchell coastal subwatershed (02–03), according to the Algiers ANRH code (ANRH in
Khadidja, 2018). Oued El Hachem originates in the mounts of djebel
Boumaad at about 1400 m of altitude, takes a submeridian direction
(S–N), it has a watershed with a surface area of 224 Km
2
and a perimeter
of 80 Km and a length of about 39 Km. This wadi crosses the Cherchell
Plain and flows into the sea, including the downstream part of the
aquifer at Hamdania Beach.
The Boukourdene dam is situated at an altitude of 74 m, implanted in
1992, on the bed of El Hachem wadi, 11 km south of the Cherchell
coastline and 3 km from the upstream limit of the Cherchell aquifer. It
receives rainwater from the watershed, 20 hm
3
/year of water and 0.21
hm
3
/year of sediment (Tadrist et al., 2016), but its water capacity is 80
hm
3
. The water depth is 102 m, but the total dam height is 123 m
(Tadrist et al., 2016).
4. Data and methods
The method that addresses the need for the study is based on the
GALDIT model destineted for coastal aquifers. It was first developed
during the “EU- India INCO-DEV COASTIN” project (Mahrez et al.,
2018), whose objective was to determine the vulnerability of coastal
aquifers to marine intrusion by (Chachadi and Lobo-Ferreira, 2001a,b)
and improved by the same authors in 2005. The main condition for
application of the GALDIT method is that the bottom of the aquifer(s) is
below the mean sea level (Chachadi, 2005). This method is based on
hydrogeological, hydrological and geomorphological characteristics of
the aquifer studied (Chachadi and Lobo-Ferreira, 2001a,b; Chachadi
et al., 2003; Chachadi and Lobo Ferreira, 2007). This method is a
mapping approach, simple to use, represent measurable parameters for
which data are generally available from various sources without
detailed knowledge, serve to map the parts of an aquifer most vulnerable
to marine intrusion, and represent a basic tool for local managers and
decision-makers for future decisions to manage and protect an aquifer
from marine intrusion, which has motivated many researchers around
the world to follow this method for the development of their work
(Guezgouz n and Bouhsina; Niazi, 2007; Najib et al., 2012; Batchi et al.,
2014; Bouderbala et al., 2016; Trabelsi et al. 2016; Djoudar et al., 2017;
Boudjelil and Djafari, 2018; Kazakis et al., 2018; Mahrez et al., 2018;
Djabri et al., 2019). The different parameters requiried in the GALDIT
model and the data used to map each GALDIT parameter for the Cherchell aquifer are as follows:
- Parameter G (Groundwater occurrence); groundwater is found in
geological strata, either confined, unconfined or semi confined. The
Cherchell aquifer is unconfined in the south between Zouriche and
Bouaroua, and confined in the north (Mancet, 1972).
- Parameter A (Aquifer hydraulic conductivity); is the permeability
of a soil or rock to water under the effect of a hydraulic gradient
(Castany 1982a, 1982b). The higher the hydraulic conductivity
facing the sea, the higher the risk of marine intrusion.
The hydraulic conductivity of an aquifer is the ratio between transmissivity and thickness of aquifer (Mahrez et al., 2018).
K =
T
b
K: Hydraulic conductivity (m/day);
T: Aquifer transmissivity (m
2
/day);
b: Aquifer thickness (m).
The hydraulic conductivity calculated for the Cherchell aquifer
varies between 10 and 22 m/day.
- Parameter L (Depth to groundwater level above sea); is a very
important factor in assessing the marine intrusion of a coastal aquifer
because it determines the hydraulic pressure available to move the
seafront. As the piezometric level decreases and reaches its minimum
levels above sea level, vulnerability to marine intrusion increases.
Piezometric levels above sea level increase from north to south,
ranging from 0.8 m in the north to 16 m in the south.
- Parameter D (Distance from the shore); the impact of marine
intrusion decreases as one distance inland from the nearshore. This
parameter is measured by the topographic map of the region.
- Parameter I (Impact on existing status of sea water intrusion); it
is calculated by the ratio Cl
/(HCO3 + CO3) (Chachadi, 2005). As this ratio increases, vulnerability to marine intrusion increases (Revelle, 1941). (i) areas
intruded by seawater in all seasons where the Cl/(HCO3 + CO3) ratio
in groundwater is greater than 2, (ii) areas with predominantly
seasonal marine intrusion where the Cl/(HCO3 + CO3) ratio in
groundwater is between 1.5 and 2, and (iii) areas where no marine
intrusion has been observed in the past the ratio (Cl/(HCO3- + CO3-)
in groundwater is less than 1.5 (Chachadi, 2005).
Data on the parameters of this ratio can be found in (Table 1).
- Param` etre T (Thickness of the aquifer); the great thickness of a
coastal aquifer makes it sensitive to marine intrusion. The thickness
of the Cherchell aquifer is 5 m in the north and 20 m in the south
(Mancet, 1972).
Each indicator is characterized by its own gradient, scale and
weighting (Chachadi and Lobo Ferreira, 2007) (Table .2).
- Indicator stronght: The weight of an indicator represents the relative importance of the indicator in the marine intrusion process. The
most significant indicators have weights of 4 and the least important
of 1 indicating a parameter of lesser importance in the marine
intrusion process (Chachadi and Lobo Ferreira, 2007).
Fig. 2. Groundwater flow direction, piezometric distribution and distribution
of measuring points (wells) in the Cherchell Coastal Aquifer.
N. Amarni et al.