

52
Chapter 3 Getting Your Data to Match the Map
system, and projection) before moving forward. Reprojecting data will alter
the coordinates, map projections, and measurements from one data source
(for instance, coordinates measured in SPCS) to another system (such as
UTM). Many geospatial software packages will give you the capability to take
your initial dataset (such as your street map in State Plane NAD27) and reproject it to create a new dataset with new coordinates (so now you would have
a new street map measured in UTM NAD83). This can also be done to change
data from one map projection into another. In some cases, the software will
be able to “project on the fly” or calculate the necessary transformations without actually altering the base dataset. Whatever the case, you’ll usually avoid
The scenario described in the text is not uncommon, having multiple data sources all with different
projections, coordinate systems, and datums that
all need to be used together in a project. Without
everything aligning properly, you can end up with
points being plotted in the wrong location with
respect to the base map they’re being located on,
or street data not lining up with a satellite image
of the same area. What kind of effects could this
type of simple data mismatch have on real-world
companies or government agencies? For instance,
what if the sewer data and the street data that a
road construction work crew has for renovations of
subdivision streets doesn’t align properly (due to
differing datums or projections)? What potential effects can this have? When the misalignment of data
may cause one dataset to be off from its properly
matched place with a map by a large margin, what
could occur? Similarly, what types of effects could
happen with things like shoreline construction,
zoning maps, or species habitat mapping?
What Happens When Measurements Don’t Match Up?
Thinking Critically with Geospatial Technology 3.1
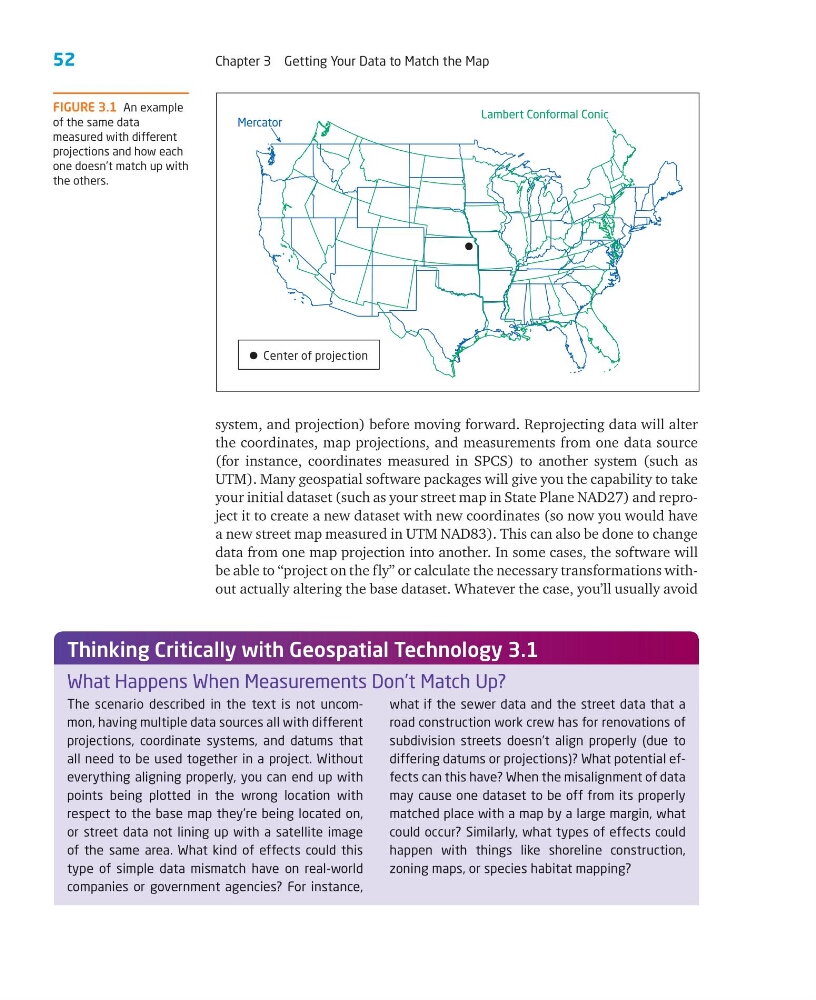
FIGURE 3.1 An example
of the same data
measured with different
projections and how each
one doesn’t match up with
the others.
Mercator
Lambert Conformal Conic
Center of projection
Chapter 3 Getting Your Data to Match the Map
system, and projection) before moving forward. Reprojecting data will alter
the coordinates, map projections, and measurements from one data source
(for instance, coordinates measured in SPCS) to another system (such as
UTM). Many geospatial software packages will give you the capability to take
your initial dataset (such as your street map in State Plane NAD27) and reproject it to create a new dataset with new coordinates (so now you would have
a new street map measured in UTM NAD83). This can also be done to change
data from one map projection into another. In some cases, the software will
be able to “project on the fly” or calculate the necessary transformations without actually altering the base dataset. Whatever the case, you’ll usually avoid
The scenario described in the text is not uncommon, having multiple data sources all with different
projections, coordinate systems, and datums that
all need to be used together in a project. Without
everything aligning properly, you can end up with
points being plotted in the wrong location with
respect to the base map they’re being located on,
or street data not lining up with a satellite image
of the same area. What kind of effects could this
type of simple data mismatch have on real-world
companies or government agencies? For instance,
what if the sewer data and the street data that a
road construction work crew has for renovations of
subdivision streets doesn’t align properly (due to
differing datums or projections)? What potential effects can this have? When the misalignment of data
may cause one dataset to be off from its properly
matched place with a map by a large margin, what
could occur? Similarly, what types of effects could
happen with things like shoreline construction,
zoning maps, or species habitat mapping?
What Happens When Measurements Don’t Match Up?
Thinking Critically with Geospatial Technology 3.1
FIGURE 3.1 An example
of the same data
measured with different
projections and how each
one doesn’t match up with
the others.
Mercator
Lambert Conformal Conic
Center of projection