

360
Chapter 12 Studying the Environment from Space
FIGURE 12.8 Imagery of
tropical cyclone Ramasun
in 2002 as obtained by
the AIRS, AMSU-A, and
HSB instruments onboard
Aqua. (Source: NASA/JPL)
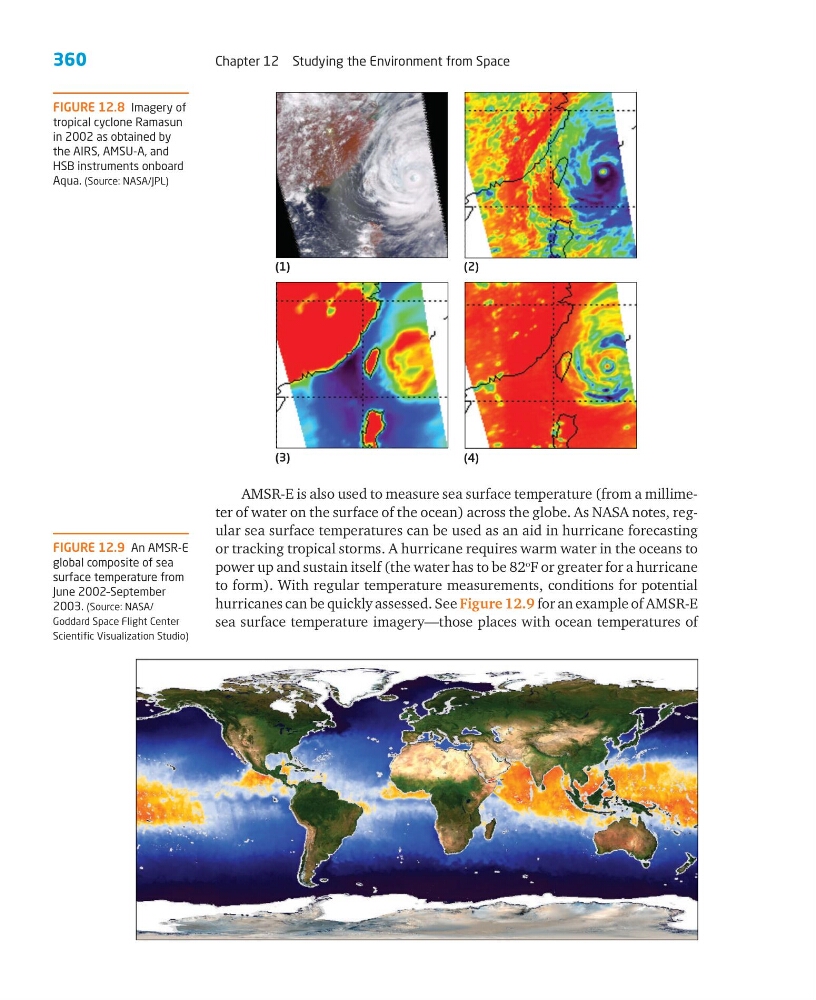
FIGURE 12.9 An AMSR-E
global composite of sea
surface temperature from
June 2002–September
2003. (Source: NASA/
Goddard Space Flight Center
Scientific Visualization Studio)
AMSR-E is also used to measure sea surface temperature (from a millimeter of water on the surface of the ocean) across the globe. As NASA notes, regular sea surface temperatures can be used as an aid in hurricane forecasting
or tracking tropical storms. A hurricane requires warm water in the oceans to
power up and sustain itself (the water has to be 82
o
F or greater for a hurricane
to form). With regular temperature measurements, conditions for potential
hurricanes can be quickly assessed. See Figure 12.9 for an example of AMSR-E
sea surface temperature imagery—those places with ocean temperatures of
(1)
(2)
(3)
(4)
Chapter 12 Studying the Environment from Space
FIGURE 12.8 Imagery of
tropical cyclone Ramasun
in 2002 as obtained by
the AIRS, AMSU-A, and
HSB instruments onboard
Aqua. (Source: NASA/JPL)
FIGURE 12.9 An AMSR-E
global composite of sea
surface temperature from
June 2002–September
2003. (Source: NASA/
Goddard Space Flight Center
Scientific Visualization Studio)
AMSR-E is also used to measure sea surface temperature (from a millimeter of water on the surface of the ocean) across the globe. As NASA notes, regular sea surface temperatures can be used as an aid in hurricane forecasting
or tracking tropical storms. A hurricane requires warm water in the oceans to
power up and sustain itself (the water has to be 82
o
F or greater for a hurricane
to form). With regular temperature measurements, conditions for potential
hurricanes can be quickly assessed. See Figure 12.9 for an example of AMSR-E
sea surface temperature imagery—those places with ocean temperatures of
(1)
(2)
(3)
(4)