

197
What Kinds of Colors Are Best to Use with GIS Maps?
What Kinds of Colors Are Best
to Use with GIS Maps?
The choice of color for a map is also important—first to create something
pleasing for the map reader, but also for graphic design and use in a digital
format. For instance, the choropleth maps in Figure 7.8 used a range of values
of dark green for low percentages and bright blue for high percentages, but
there are a lot of ways those classifications could have been colored. There
are different color schemes for use in GIS maps—one of these is RGB, a setup
used for design on computer screens. RGB utilizes the colors red, green, and
blue as the primary colors, mixing them together as needed to create other
hues. Another is CMYK, used in graphic design, which uses the colors of cyan,
magenta, yellow, and black (the “K” of the title) for creating hues. Chapter 10
will deal further with generating different colors from an initial set of primary
colors in the context of examining digital imagery.
With a reference map, different colors are used to represent the various
objects and symbols. On a choropleth map (like those shown in Figure 7.8), a
range of shades or colors is needed to show the lowest classes of data through
the highest classes. In this case, a color ramp is used to show a set of colors
to represent the classes of values. A color ramp is a selected set of colors that
will show changes of a color scheme—for instance, using a single hue of a
color in a color ramp might run the range of lightest to darkest blue or light
green to very dark green. Other color ramps (like those shown in Figure 7.8)
incorporate multiple hues ranging from green through blue. Several different
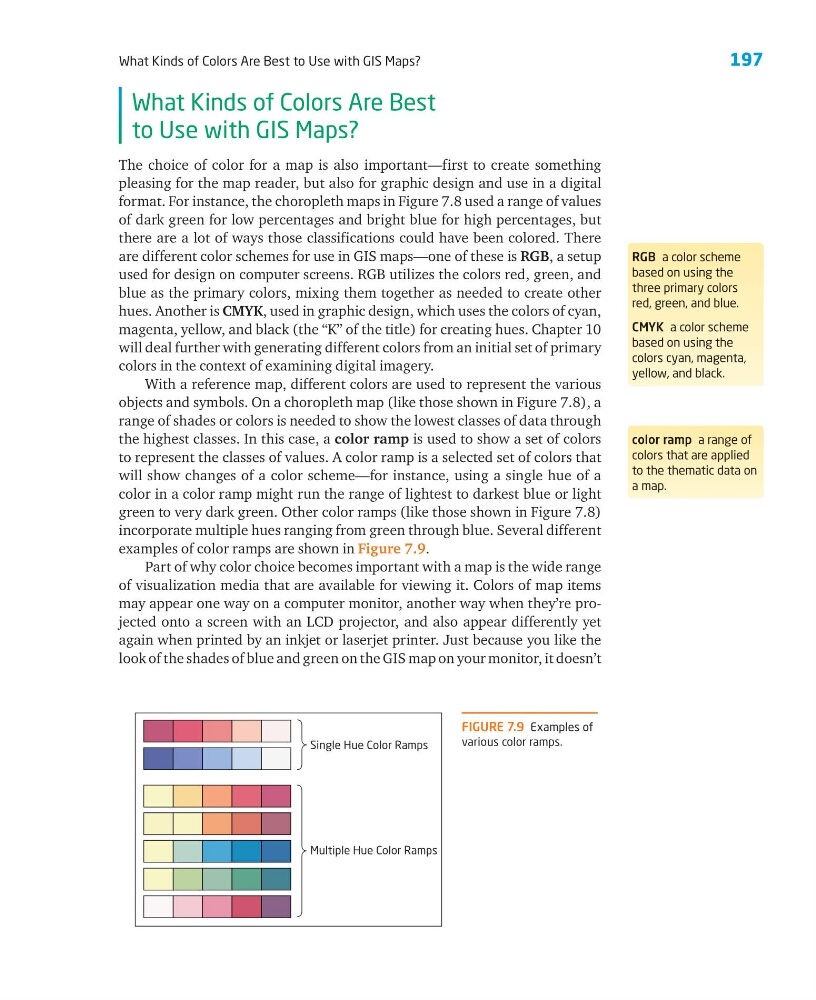
examples of color ramps are shown in Figure 7.9.
Part of why color choice becomes important with a map is the wide range
of visualization media that are available for viewing it. Colors of map items
may appear one way on a computer monitor, another way when they’re projected onto a screen with an LCD projector, and also appear differently yet
again when printed by an inkjet or laserjet printer. Just because you like the
look of the shades of blue and green on the GIS map on your monitor, it doesn’t
RGB a color scheme
based on using the
three primary colors
red, green, and blue.
CMYK a color scheme
based on using the
colors cyan, magenta,
yellow, and black.
color ramp a range of
colors that are applied
to the thematic data on
a map.
FIGURE 7.9 Examples of
various color ramps.
Multiple Hue Color Ramps
Single Hue Color Ramps
What Kinds of Colors Are Best to Use with GIS Maps?
What Kinds of Colors Are Best
to Use with GIS Maps?
The choice of color for a map is also important—first to create something
pleasing for the map reader, but also for graphic design and use in a digital
format. For instance, the choropleth maps in Figure 7.8 used a range of values
of dark green for low percentages and bright blue for high percentages, but
there are a lot of ways those classifications could have been colored. There
are different color schemes for use in GIS maps—one of these is RGB, a setup
used for design on computer screens. RGB utilizes the colors red, green, and
blue as the primary colors, mixing them together as needed to create other
hues. Another is CMYK, used in graphic design, which uses the colors of cyan,
magenta, yellow, and black (the “K” of the title) for creating hues. Chapter 10
will deal further with generating different colors from an initial set of primary
colors in the context of examining digital imagery.
With a reference map, different colors are used to represent the various
objects and symbols. On a choropleth map (like those shown in Figure 7.8), a
range of shades or colors is needed to show the lowest classes of data through
the highest classes. In this case, a color ramp is used to show a set of colors
to represent the classes of values. A color ramp is a selected set of colors that
will show changes of a color scheme—for instance, using a single hue of a
color in a color ramp might run the range of lightest to darkest blue or light
green to very dark green. Other color ramps (like those shown in Figure 7.8)
incorporate multiple hues ranging from green through blue. Several different
examples of color ramps are shown in Figure 7.9.
Part of why color choice becomes important with a map is the wide range
of visualization media that are available for viewing it. Colors of map items
may appear one way on a computer monitor, another way when they’re projected onto a screen with an LCD projector, and also appear differently yet
again when printed by an inkjet or laserjet printer. Just because you like the
look of the shades of blue and green on the GIS map on your monitor, it doesn’t
RGB a color scheme
based on using the
three primary colors
red, green, and blue.
CMYK a color scheme
based on using the
colors cyan, magenta,
yellow, and black.
color ramp a range of
colors that are applied
to the thematic data on
a map.
FIGURE 7.9 Examples of
various color ramps.
Multiple Hue Color Ramps
Single Hue Color Ramps