

Télédétection et ressources en eau/Remote sensing and water resources
309
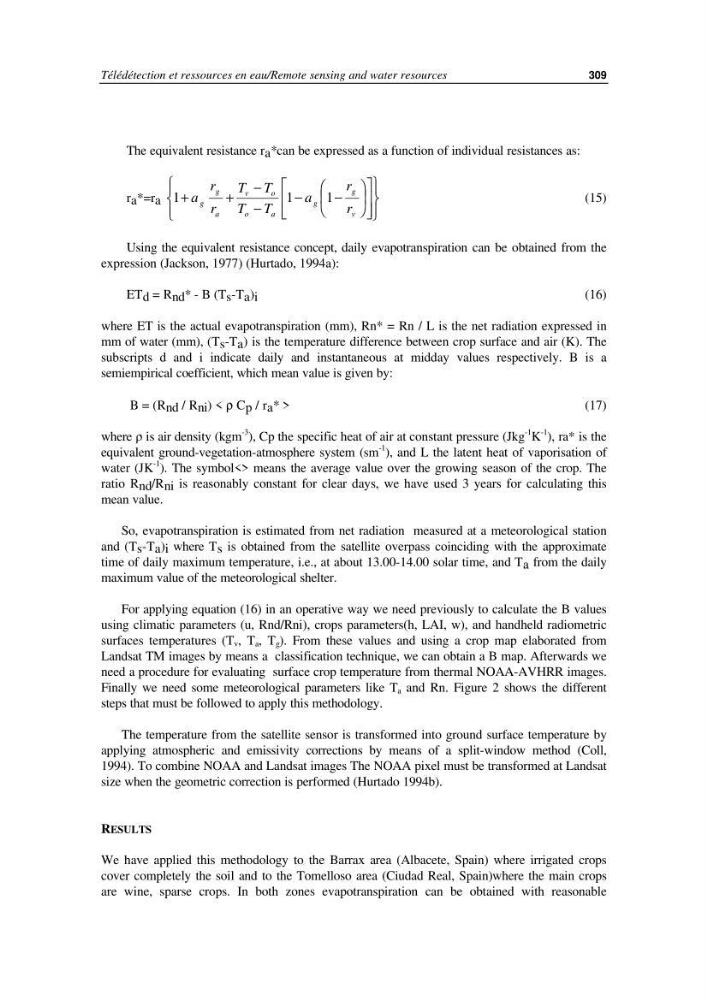
The equivalent resistance r a *can be expressed as a function of individual resistances as:
r a *=r a 1
1
1
+
+
−
−
−
−
a
r
r
T T
T T
a
r
r
g
g
a
v
o
o
a
g
g
v
(15)
Using the equivalent resistance concept, daily evapotranspiration can be obtained from the
expression (Jackson, 1977) (Hurtado, 1994a):
ET d = R nd * - B (T s -T a ) i
(16)
where ET is the actual evapotranspiration (mm), Rn* = Rn / L is the net radiation expressed in
mm of water (mm), (T s -T a ) is the temperature difference between crop surface and air (K). The
subscripts d and i indicate daily and instantaneous at midday values respectively. B is a
semiempirical coefficient, which mean value is given by:
B = (R nd / R ni ) < ρ C p / r a * >
(17)
where Y is air density (kgm
-3
), Cp the specific heat of air at constant pressure (Jkg
-1
K
-1
), ra* is the
equivalent ground-vegetation-atmosphere system (sm
-1
), and L the latent heat of vaporisation of
water (JK
-1
). The symbol<> means the average value over the growing season of the crop. The
ratio R nd /R ni is reasonably constant for clear days, we have used 3 years for calculating this
mean value.
So, evapotranspiration is estimated from net radiation measured at a meteorological station
and (T s -T a ) i where T s is obtained from the satellite overpass coinciding with the approximate
time of daily maximum temperature, i.e., at about 13.00-14.00 solar time, and T a from the daily
maximum value of the meteorological shelter.
For applying equation (16) in an operative way we need previously to calculate the B values
using climatic parameters (u, Rnd/Rni), crops parameters(h, LAI, w), and handheld radiometric
surfaces temperatures (T v , T a , T g ). From these values and using a crop map elaborated from
Landsat TM images by means a classification technique, we can obtain a B map. Afterwards we
need a procedure for evaluating surface crop temperature from thermal NOAA-AVHRR images.
Finally we need some meteorological parameters like T a and Rn. Figure 2 shows the different
steps that must be followed to apply this methodology.
The temperature from the satellite sensor is transformed into ground surface temperature by
applying atmospheric and emissivity corrections by means of a split-window method (Coll,
1994). To combine NOAA and Landsat images The NOAA pixel must be transformed at Landsat
size when the geometric correction is performed (Hurtado 1994b).
RESULTS
We have applied this methodology to the Barrax area (Albacete, Spain) where irrigated crops
cover completely the soil and to the Tomelloso area (Ciudad Real, Spain)where the main crops
are wine, sparse crops. In both zones evapotranspiration can be obtained with reasonable
309
The equivalent resistance r a *can be expressed as a function of individual resistances as:
r a *=r a 1
1
1
+
+
−
−
−
−
a
r
r
T T
T T
a
r
r
g
g
a
v
o
o
a
g
g
v
(15)
Using the equivalent resistance concept, daily evapotranspiration can be obtained from the
expression (Jackson, 1977) (Hurtado, 1994a):
ET d = R nd * - B (T s -T a ) i
(16)
where ET is the actual evapotranspiration (mm), Rn* = Rn / L is the net radiation expressed in
mm of water (mm), (T s -T a ) is the temperature difference between crop surface and air (K). The
subscripts d and i indicate daily and instantaneous at midday values respectively. B is a
semiempirical coefficient, which mean value is given by:
B = (R nd / R ni ) < ρ C p / r a * >
(17)
where Y is air density (kgm
-3
), Cp the specific heat of air at constant pressure (Jkg
-1
K
-1
), ra* is the
equivalent ground-vegetation-atmosphere system (sm
-1
), and L the latent heat of vaporisation of
water (JK
-1
). The symbol<> means the average value over the growing season of the crop. The
ratio R nd /R ni is reasonably constant for clear days, we have used 3 years for calculating this
mean value.
So, evapotranspiration is estimated from net radiation measured at a meteorological station
and (T s -T a ) i where T s is obtained from the satellite overpass coinciding with the approximate
time of daily maximum temperature, i.e., at about 13.00-14.00 solar time, and T a from the daily
maximum value of the meteorological shelter.
For applying equation (16) in an operative way we need previously to calculate the B values
using climatic parameters (u, Rnd/Rni), crops parameters(h, LAI, w), and handheld radiometric
surfaces temperatures (T v , T a , T g ). From these values and using a crop map elaborated from
Landsat TM images by means a classification technique, we can obtain a B map. Afterwards we
need a procedure for evaluating surface crop temperature from thermal NOAA-AVHRR images.
Finally we need some meteorological parameters like T a and Rn. Figure 2 shows the different
steps that must be followed to apply this methodology.
The temperature from the satellite sensor is transformed into ground surface temperature by
applying atmospheric and emissivity corrections by means of a split-window method (Coll,
1994). To combine NOAA and Landsat images The NOAA pixel must be transformed at Landsat
size when the geometric correction is performed (Hurtado 1994b).
RESULTS
We have applied this methodology to the Barrax area (Albacete, Spain) where irrigated crops
cover completely the soil and to the Tomelloso area (Ciudad Real, Spain)where the main crops
are wine, sparse crops. In both zones evapotranspiration can be obtained with reasonable