

Session 2 : Assessment of irrigation potential in Africa
122
earlier. For each scenario (potential and actual), a figure for gross irrigation water requirements is
obtained for each of the 1 437 units. Those results are subsequently plotted on Arc-Info (Figure 6). A
manual adjustment leads finally to the identification of 84 areas of relatively homogeneous cropping
pattern and gross irrigation water requirements, which are subsequently digitized (Figure 7).
These results are then combined with water resources on one side, and soils suitable for irrigation
on the other, for the assessment of the physical irrigation potential.
DISCUSSION
The method that was used is based on a combination of GIS and water balance calculation programs at
regional level. For the regional assessment of irrigation water requirements, as far as possible the
information available through GIS was used. The major constraint observed is the limited amount of
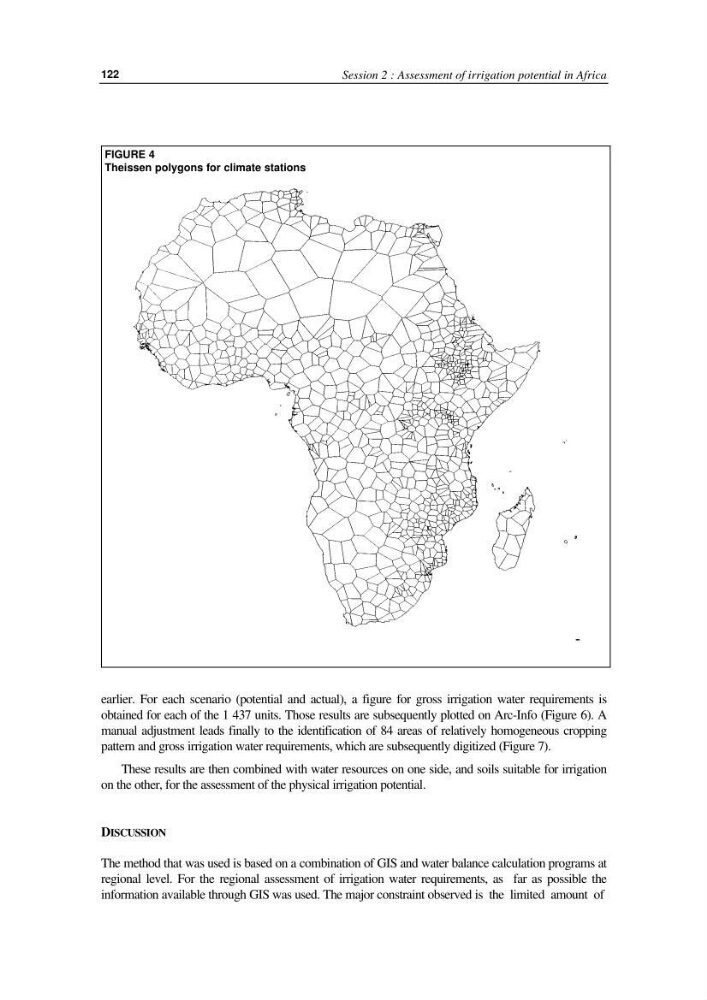
FIGURE 4
Theissen polygons for climate stations
122
earlier. For each scenario (potential and actual), a figure for gross irrigation water requirements is
obtained for each of the 1 437 units. Those results are subsequently plotted on Arc-Info (Figure 6). A
manual adjustment leads finally to the identification of 84 areas of relatively homogeneous cropping
pattern and gross irrigation water requirements, which are subsequently digitized (Figure 7).
These results are then combined with water resources on one side, and soils suitable for irrigation
on the other, for the assessment of the physical irrigation potential.
DISCUSSION
The method that was used is based on a combination of GIS and water balance calculation programs at
regional level. For the regional assessment of irrigation water requirements, as far as possible the
information available through GIS was used. The major constraint observed is the limited amount of
FIGURE 4
Theissen polygons for climate stations