

derived from the second scenario are displayed in Figure 13.8a; the results from the
first scenario are given in Figure 13.8b. The red dots represent the runoff time series
generated from the satellite rainfall estimates. The results show that the reliability of
estimated stream flow is highly related to the intensity of the input-forcing data.
For both error propagation cases, the uncertainty bound is significantly higher during
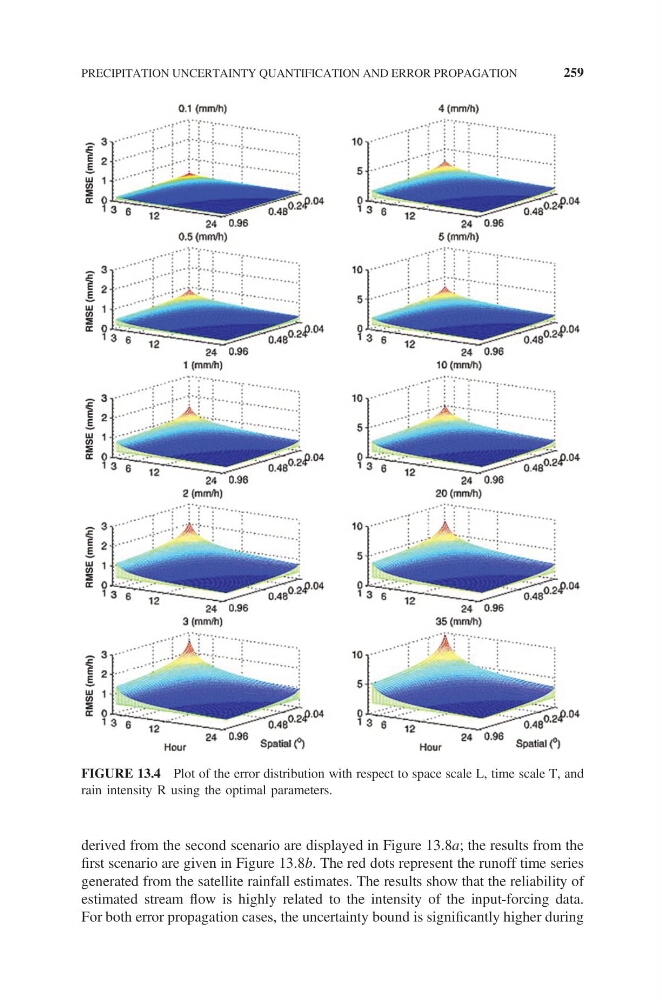
FIGURE 13.4 Plot of the error distribution with respect to space scale L, time scale T, and
rain intensity R using the optimal parameters.
PRECIPITATION UNCERTAINTY QUANTIFICATION AND ERROR PROPAGATION
259
first scenario are given in Figure 13.8b. The red dots represent the runoff time series
generated from the satellite rainfall estimates. The results show that the reliability of
estimated stream flow is highly related to the intensity of the input-forcing data.
For both error propagation cases, the uncertainty bound is significantly higher during
FIGURE 13.4 Plot of the error distribution with respect to space scale L, time scale T, and
rain intensity R using the optimal parameters.
PRECIPITATION UNCERTAINTY QUANTIFICATION AND ERROR PROPAGATION
259