

forcing data is generat ed and then thei r hydrologica l predi ction uncert ainty is
quanti fied at diff erent con fidence internal levels.
13.3.2 Uncer tainty Quanti fica tion o f Satellite Precipit ation Estimatio n
In this study , the error of preci pitatio n s E is considered as a funct ion of its spati al
resoluti on L, time integrati on T , samplin g freque ncy D t , and the space –tim e average
of rain rate
^
R , as show n in the equation
s E = f
1
L
;
D t
T
;
^
R
= a
1
L
b Dt
T
c
^
R
d
(13.1)
The error of preci pitation s E refers to the stand ard deviation between the reference
rainfall data (i.e., the NWS WSR-88D stage IV data) and the estimated satelli te
rainfall data [i.e., PERSIA NN-CC S: Precip itation Estimation from Rem ote Sensed
Informat ion Using Arti ficial Neural Net work –Cloud Cl assi ficati on System (Hong
et al., 20 04) in this study ]. The NWS WSR -88D stage IV data, wi th manua l quali ty
control, serve as ground refere nce rainfall data at 4 km ´ 4 km spatial and hourly
temporal resol ution. Stage IV data with high spatial and temporal resol ution rainf all
analysis provi de data useful for testing of satellite rainf all estimation algorithms.
Additiona l infor mation about the Nat ional Cen ters for Env ironment al Predic tion
(NCEP) stage IV analys is can be found at http ://wwwt.em c.ncep.no aa.gov/ mmb/yl in/
pcpanl /stage4/ . The PERSIA NN-CCS is a segm ent-ba sed cloud class ifi cation and
rainfall estimation system based on coregistered passive microwave and infrared
images from low Earth-orbiting and geostationary satellites by using computer image
proces sing and patt ern recogni tion techniques. We operate this system (htt p://hydis8
.eng.uci .edu/GCC S/) wi th the goal of produci ng data at spati al–tem poral resol ution
(reaching 4 ´ 4 km
2 , 30 min) suitable for basin scale hydrological research and
applications. PERSIANN-CCS has been generating precipitation estimates at resolution 0.04° ´ 0.04° scale and 30-min time interval since 2000.
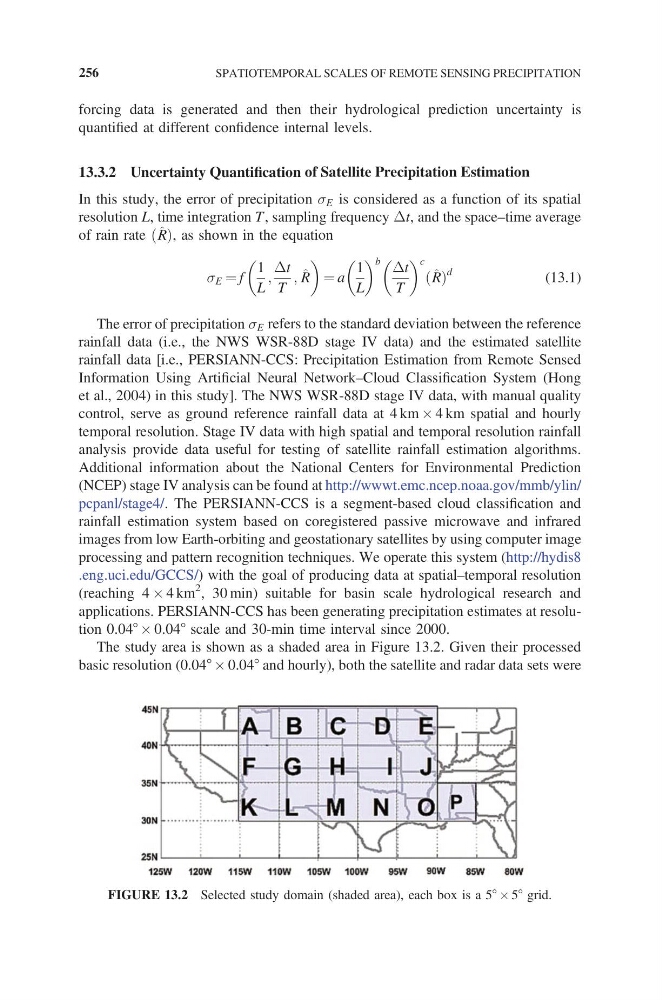
The study area is shown as a shaded area in Figure 13.2. Given their processed
basic resolution (0.04° ´ 0.04° and hourly), both the satellite and radar data sets were
FIGURE 13.2 Selected study domain (shaded area), each box is a 5° ´ 5° grid.
256
SPATIOTEMPORAL SCALES OF REMOTE SENSING PRECIPITATION
quanti fied at diff erent con fidence internal levels.
13.3.2 Uncer tainty Quanti fica tion o f Satellite Precipit ation Estimatio n
In this study , the error of preci pitatio n s E is considered as a funct ion of its spati al
resoluti on L, time integrati on T , samplin g freque ncy D t , and the space –tim e average
of rain rate
^
R , as show n in the equation
s E = f
1
L
;
D t
T
;
^
R
= a
1
L
b Dt
T
c
^
R
d
(13.1)
The error of preci pitation s E refers to the stand ard deviation between the reference
rainfall data (i.e., the NWS WSR-88D stage IV data) and the estimated satelli te
rainfall data [i.e., PERSIA NN-CC S: Precip itation Estimation from Rem ote Sensed
Informat ion Using Arti ficial Neural Net work –Cloud Cl assi ficati on System (Hong
et al., 20 04) in this study ]. The NWS WSR -88D stage IV data, wi th manua l quali ty
control, serve as ground refere nce rainfall data at 4 km ´ 4 km spatial and hourly
temporal resol ution. Stage IV data with high spatial and temporal resol ution rainf all
analysis provi de data useful for testing of satellite rainf all estimation algorithms.
Additiona l infor mation about the Nat ional Cen ters for Env ironment al Predic tion
(NCEP) stage IV analys is can be found at http ://wwwt.em c.ncep.no aa.gov/ mmb/yl in/
pcpanl /stage4/ . The PERSIA NN-CCS is a segm ent-ba sed cloud class ifi cation and
rainfall estimation system based on coregistered passive microwave and infrared
images from low Earth-orbiting and geostationary satellites by using computer image
proces sing and patt ern recogni tion techniques. We operate this system (htt p://hydis8
.eng.uci .edu/GCC S/) wi th the goal of produci ng data at spati al–tem poral resol ution
(reaching 4 ´ 4 km
2 , 30 min) suitable for basin scale hydrological research and
applications. PERSIANN-CCS has been generating precipitation estimates at resolution 0.04° ´ 0.04° scale and 30-min time interval since 2000.
The study area is shown as a shaded area in Figure 13.2. Given their processed
basic resolution (0.04° ´ 0.04° and hourly), both the satellite and radar data sets were
FIGURE 13.2 Selected study domain (shaded area), each box is a 5° ´ 5° grid.
256
SPATIOTEMPORAL SCALES OF REMOTE SENSING PRECIPITATION