

method is given below:
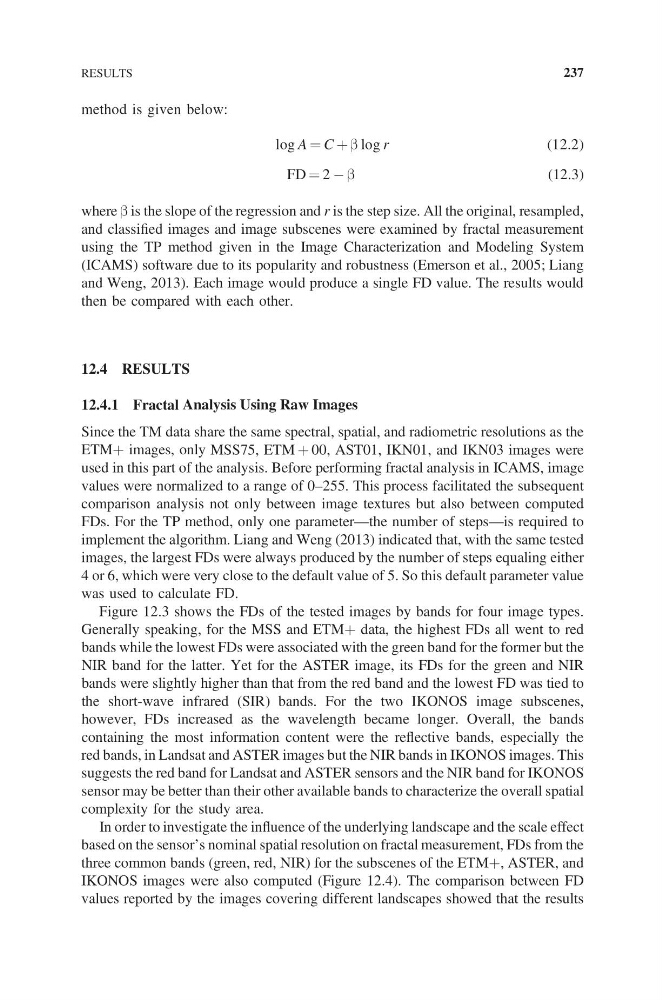
log A = C + b log r
(12.2)
FD = 2 − b
(12.3)
where b is the slope of the regression and r is the step size. All the original, resampled,
and classified images and image subscenes were examined by fractal measurement
using the TP method given in the Image Characterization and Modeling System
(ICAMS) software due to its popularity and robustness (Emerson et al., 2005; Liang
and Weng, 2013). Each image would produce a single FD value. The results would
then be compared with each other.
12.4 RESULTS
12.4.1 Fractal Analysis Using Raw Images
Since the TM data share the same spectral, spatial, and radiometric resolutions as the
ETM+ images, only MSS75, ETM + 00, AST01, IKN01, and IKN03 images were
used in this part of the analysis. Before performing fractal analysis in ICAMS, image
values were normalized to a range of 0–255. This process facilitated the subsequent
comparison analysis not only between image textures but also between computed
FDs. For the TP method, only one parameter—the number of steps—is required to
implement the algorithm. Liang and Weng (2013) indicated that, with the same tested
images, the largest FDs were always produced by the number of steps equaling either
4 or 6, which were very close to the default value of 5. So this default parameter value
was used to calculate FD.
Figure 12.3 shows the FDs of the tested images by bands for four image types.
Generally speaking, for the MSS and ETM+ data, the highest FDs all went to red
bands while the lowest FDs were associated with the green band for the former but the
NIR band for the latter. Yet for the ASTER image, its FDs for the green and NIR
bands were slightly higher than that from the red band and the lowest FD was tied to
the short-wave infrared (SIR) bands. For the two IKONOS image subscenes,
however, FDs increased as the wavelength became longer. Overall, the bands
containing the most information content were the reflective bands, especially the
red bands, in Landsat and ASTER images but the NIR bands in IKONOS images. This
suggests the red band for Landsat and ASTER sensors and the NIR band for IKONOS
sensor may be better than their other available bands to characterize the overall spatial
complexity for the study area.
In order to investigate the influence of the underlying landscape and the scale effect
based on the sensor’s nominal spatial resolution on fractal measurement, FDs from the
three common bands (green, red, NIR) for the subscenes of the ETM+, ASTER, and
IKONOS images were also computed (Figure 12.4). The comparison between FD
values reported by the images covering different landscapes showed that the results
RESULTS
237
log A = C + b log r
(12.2)
FD = 2 − b
(12.3)
where b is the slope of the regression and r is the step size. All the original, resampled,
and classified images and image subscenes were examined by fractal measurement
using the TP method given in the Image Characterization and Modeling System
(ICAMS) software due to its popularity and robustness (Emerson et al., 2005; Liang
and Weng, 2013). Each image would produce a single FD value. The results would
then be compared with each other.
12.4 RESULTS
12.4.1 Fractal Analysis Using Raw Images
Since the TM data share the same spectral, spatial, and radiometric resolutions as the
ETM+ images, only MSS75, ETM + 00, AST01, IKN01, and IKN03 images were
used in this part of the analysis. Before performing fractal analysis in ICAMS, image
values were normalized to a range of 0–255. This process facilitated the subsequent
comparison analysis not only between image textures but also between computed
FDs. For the TP method, only one parameter—the number of steps—is required to
implement the algorithm. Liang and Weng (2013) indicated that, with the same tested
images, the largest FDs were always produced by the number of steps equaling either
4 or 6, which were very close to the default value of 5. So this default parameter value
was used to calculate FD.
Figure 12.3 shows the FDs of the tested images by bands for four image types.
Generally speaking, for the MSS and ETM+ data, the highest FDs all went to red
bands while the lowest FDs were associated with the green band for the former but the
NIR band for the latter. Yet for the ASTER image, its FDs for the green and NIR
bands were slightly higher than that from the red band and the lowest FD was tied to
the short-wave infrared (SIR) bands. For the two IKONOS image subscenes,
however, FDs increased as the wavelength became longer. Overall, the bands
containing the most information content were the reflective bands, especially the
red bands, in Landsat and ASTER images but the NIR bands in IKONOS images. This
suggests the red band for Landsat and ASTER sensors and the NIR band for IKONOS
sensor may be better than their other available bands to characterize the overall spatial
complexity for the study area.
In order to investigate the influence of the underlying landscape and the scale effect
based on the sensor’s nominal spatial resolution on fractal measurement, FDs from the
three common bands (green, red, NIR) for the subscenes of the ETM+, ASTER, and
IKONOS images were also computed (Figure 12.4). The comparison between FD
values reported by the images covering different landscapes showed that the results
RESULTS
237