

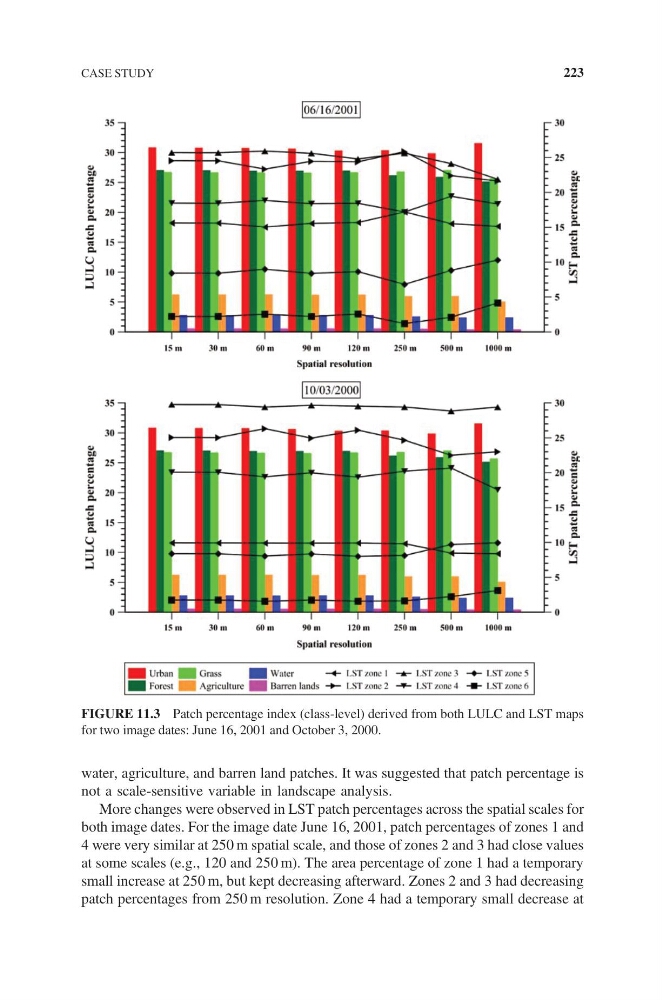
water, agriculture, and barren land patches. It was suggested that patch percentage is
not a scale-sensitive variable in landscape analysis.
More changes were observed in LST patch percentages across the spatial scales for
both image dates. For the image date June 16, 2001, patch percentages of zones 1 and
4 were very similar at 250 m spatial scale, and those of zones 2 and 3 had close values
at some scales (e.g., 120 and 250 m). The area percentage of zone 1 had a temporary
small increase at 250 m, but kept decreasing afterward. Zones 2 and 3 had decreasing
patch percentages from 250 m resolution. Zone 4 had a temporary small decrease at
FIGURE 11.3 Patch percentage index (class-level) derived from both LULC and LST maps
for two image dates: June 16, 2001 and October 3, 2000.
CASE STUDY
223
not a scale-sensitive variable in landscape analysis.
More changes were observed in LST patch percentages across the spatial scales for
both image dates. For the image date June 16, 2001, patch percentages of zones 1 and
4 were very similar at 250 m spatial scale, and those of zones 2 and 3 had close values
at some scales (e.g., 120 and 250 m). The area percentage of zone 1 had a temporary
small increase at 250 m, but kept decreasing afterward. Zones 2 and 3 had decreasing
patch percentages from 250 m resolution. Zone 4 had a temporary small decrease at
FIGURE 11.3 Patch percentage index (class-level) derived from both LULC and LST maps
for two image dates: June 16, 2001 and October 3, 2000.
CASE STUDY
223