

percentages. Within the same window of scale changing, the measurements of patch
percentages for water, agriculture, and barren land were more stable. It implies that the
assessment of patch percentages for domain LULC types seemed to be more sensitive
to the scaling-up process. A possible explanation was that more forest and grass
patches were aggregated into urban patches during image resampling than those of
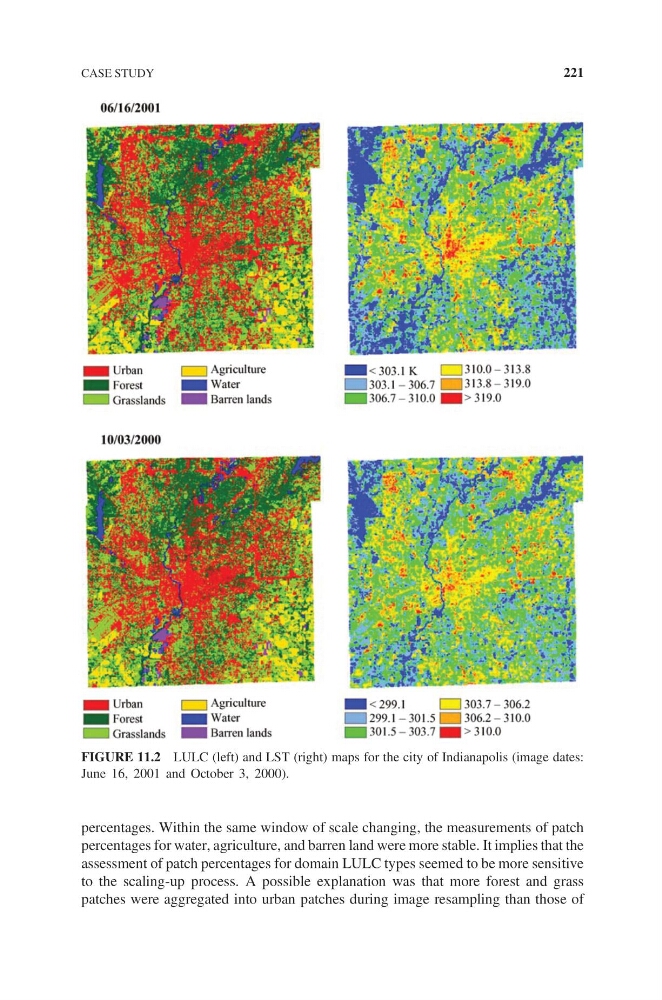
FIGURE 11.2 LULC (left) and LST (right) maps for the city of Indianapolis (image dates:
June 16, 2001 and October 3, 2000).
CASE STUDY
221
percentages for water, agriculture, and barren land were more stable. It implies that the
assessment of patch percentages for domain LULC types seemed to be more sensitive
to the scaling-up process. A possible explanation was that more forest and grass
patches were aggregated into urban patches during image resampling than those of
FIGURE 11.2 LULC (left) and LST (right) maps for the city of Indianapolis (image dates:
June 16, 2001 and October 3, 2000).
CASE STUDY
221