

average annual precipitation is 39.9 in., with about 2.3 in. in January and about 4.6 in.
in July. It is located on a flat plain, and is relatively symmetrical, having possibilities
of expansion in all directions.
11.2.2 Data Processing
Two Advanced Spaceborne Thermal Emission and Reflection Radiometer (ASTER)
imagery were used to derive LULC types and LSTs for the city on two image dates,
June 16, 2001 and October 3, 2000 (Table 11.1). Each ASTER images possesses 14
bands from visible to thermal infrared regions (15–90 m spatial resolution) (ASTER
online products description, 2005). Cloud cover of each image was below 10%. Both
images were geocorrected to Universal Transverse Mercator projection (zone 16).
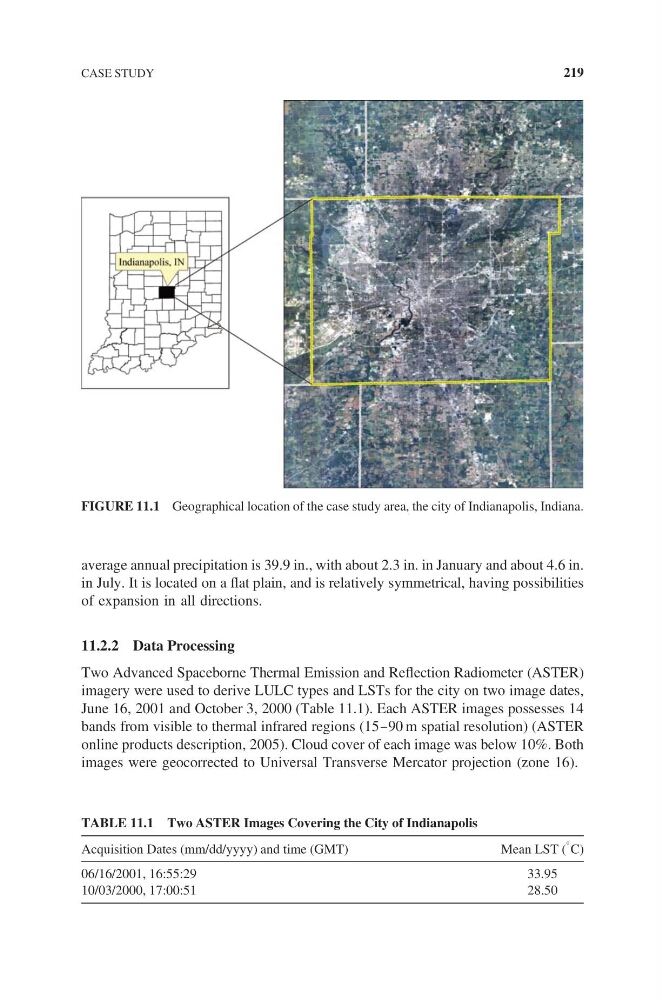
FIGURE 11.1 Geographical location of the case study area, the city of Indianapolis, Indiana.
TABLE 11.1 Two ASTER Images Covering the City of Indianapolis
Acquisition Dates (mm/dd/yyyy) and time (GMT)
Mean LST (
C)
06/16/2001, 16:55:29
33.95
10/03/2000, 17:00:51
28.50
CASE STUDY
219
in July. It is located on a flat plain, and is relatively symmetrical, having possibilities
of expansion in all directions.
11.2.2 Data Processing
Two Advanced Spaceborne Thermal Emission and Reflection Radiometer (ASTER)
imagery were used to derive LULC types and LSTs for the city on two image dates,
June 16, 2001 and October 3, 2000 (Table 11.1). Each ASTER images possesses 14
bands from visible to thermal infrared regions (15–90 m spatial resolution) (ASTER
online products description, 2005). Cloud cover of each image was below 10%. Both
images were geocorrected to Universal Transverse Mercator projection (zone 16).
FIGURE 11.1 Geographical location of the case study area, the city of Indianapolis, Indiana.
TABLE 11.1 Two ASTER Images Covering the City of Indianapolis
Acquisition Dates (mm/dd/yyyy) and time (GMT)
Mean LST (
C)
06/16/2001, 16:55:29
33.95
10/03/2000, 17:00:51
28.50
CASE STUDY
219