

was able to detect building objects (Figures 9.5h,i) and in particular when it was
constrained by the LSD features (the scale parameter for the simplification was 400).
Again similar problems occurred with the mean-shift algorithm (Figure 9.5b)
obtaining objects at different scales (i.e., larger objects in low contrast areas of
the image). On the other hand, the watershed algorithm produced an oversegmentation (Figure 9.5c) but kept all image objects on the same scale. The multiresolution
segmentation (eCognition) algorithm provided objects of the same scale (Figure 9.5d),
with less oversegmentation problems than the watershed but did not outperform meanshift and enhanced MSEG algorithms. Both enhanced MSEG and mean-shift algorithms had good results in building objects with the developed method having a small
advantage in preserving the edges of the image semantics.
9.4.4 Hyperspectral Remote Sensing Data
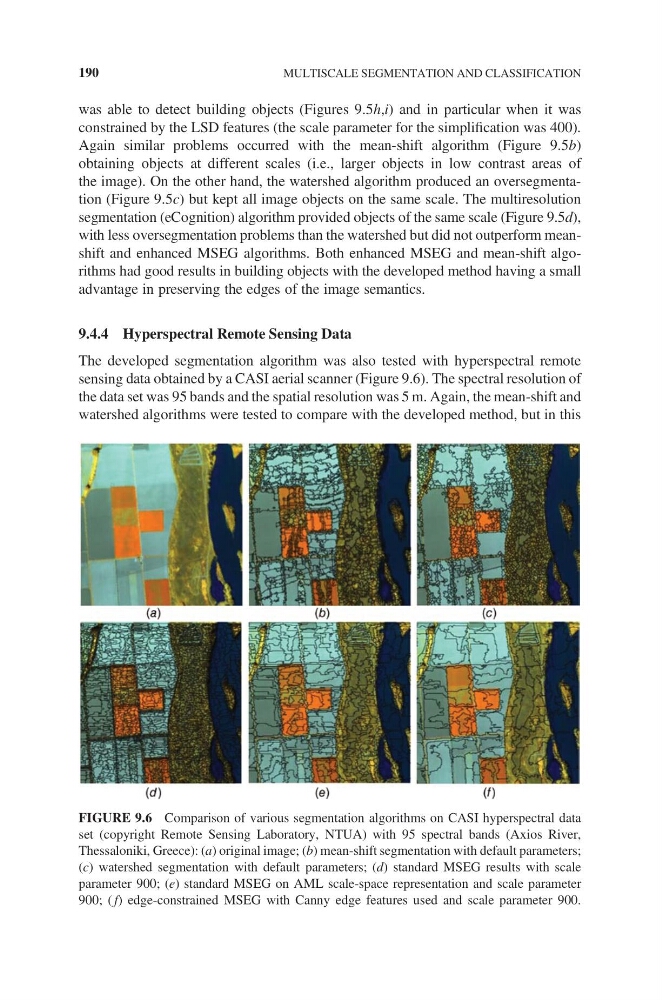
The developed segmentation algorithm was also tested with hyperspectral remote
sensing data obtained by a CASI aerial scanner (Figure 9.6). The spectral resolution of
the data set was 95 bands and the spatial resolution was 5 m. Again, the mean-shift and
watershed algorithms were tested to compare with the developed method, but in this
FIGURE 9.6 Comparison of various segmentation algorithms on CASI hyperspectral data
set (copyright Remote Sensing Laboratory, NTUA) with 95 spectral bands (Axios River,
Thessaloniki, Greece): (a) original image; (b) mean-shift segmentation with default parameters;
(c) watershed segmentation with default parameters; (d) standard MSEG results with scale
parameter 900; (e) standard MSEG on AML scale-space representation and scale parameter
900; ( f) edge-constrained MSEG with Canny edge features used and scale parameter 900.
190
MULTISCALE SEGMENTATION AND CLASSIFICATION
constrained by the LSD features (the scale parameter for the simplification was 400).
Again similar problems occurred with the mean-shift algorithm (Figure 9.5b)
obtaining objects at different scales (i.e., larger objects in low contrast areas of
the image). On the other hand, the watershed algorithm produced an oversegmentation (Figure 9.5c) but kept all image objects on the same scale. The multiresolution
segmentation (eCognition) algorithm provided objects of the same scale (Figure 9.5d),
with less oversegmentation problems than the watershed but did not outperform meanshift and enhanced MSEG algorithms. Both enhanced MSEG and mean-shift algorithms had good results in building objects with the developed method having a small
advantage in preserving the edges of the image semantics.
9.4.4 Hyperspectral Remote Sensing Data
The developed segmentation algorithm was also tested with hyperspectral remote
sensing data obtained by a CASI aerial scanner (Figure 9.6). The spectral resolution of
the data set was 95 bands and the spatial resolution was 5 m. Again, the mean-shift and
watershed algorithms were tested to compare with the developed method, but in this
FIGURE 9.6 Comparison of various segmentation algorithms on CASI hyperspectral data
set (copyright Remote Sensing Laboratory, NTUA) with 95 spectral bands (Axios River,
Thessaloniki, Greece): (a) original image; (b) mean-shift segmentation with default parameters;
(c) watershed segmentation with default parameters; (d) standard MSEG results with scale
parameter 900; (e) standard MSEG on AML scale-space representation and scale parameter
900; ( f) edge-constrained MSEG with Canny edge features used and scale parameter 900.
190
MULTISCALE SEGMENTATION AND CLASSIFICATION