

layers of the SS stack may be invalid. This is because the corresponding number of
layers (200) has been arbitrarily designated (without reference to anything ecological), which is an obvious limitation of this method. It could have just as easily been 20
or 2222 as 200. However, the concept that interactions tend to be stronger and more
frequent within a domain than among domains has provided critical insight into how
to remedy this assumption.
Conceptually, all event types that are generated from a single hyperblob exist
between a creation and annihilation. Thus corresponding creations, splits, and
merges are all members within the same scale domain. Only annihilations represent
a discrete thresholding of the structure(s) above and below. Therefore, by integrating the concept of hierarchical thresholds with geostatistics and 3D visualization
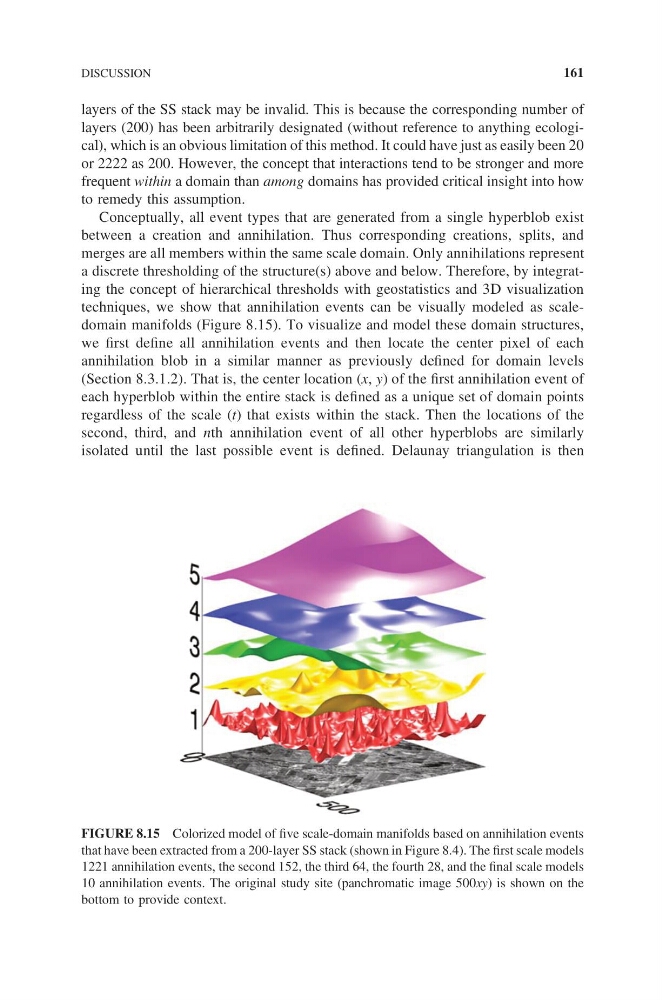
techniques, we show that annihilation events can be visually modeled as scaledomain manifolds (Figure 8.15). To visualize and model these domain structures,
we first define all annihilation events and then locate the center pixel of each
annihilation blob in a similar manner as previously defined for domain levels
(Section 8.3.1.2). That is, the center location (x, y) of the first annihilation event of
each hyperblob within the entire stack is defined as a unique set of domain points
regardless of the scale (t) that exists within the stack. Then the locations of the
second, third, and nth annihilation event of all other hyperblobs are similarly
isolated until the last possible event is defined. Delaunay triangulation is then
FIGURE 8.15 Colorized model of five scale-domain manifolds based on annihilation events
that have been extracted from a 200-layer SS stack (shown in Figure 8.4). The first scale models
1221 annihilation events, the second 152, the third 64, the fourth 28, and the final scale models
10 annihilation events. The original study site (panchromatic image 500xy) is shown on the
bottom to provide context.
DISCUSSION
161
layers (200) has been arbitrarily designated (without reference to anything ecological), which is an obvious limitation of this method. It could have just as easily been 20
or 2222 as 200. However, the concept that interactions tend to be stronger and more
frequent within a domain than among domains has provided critical insight into how
to remedy this assumption.
Conceptually, all event types that are generated from a single hyperblob exist
between a creation and annihilation. Thus corresponding creations, splits, and
merges are all members within the same scale domain. Only annihilations represent
a discrete thresholding of the structure(s) above and below. Therefore, by integrating the concept of hierarchical thresholds with geostatistics and 3D visualization
techniques, we show that annihilation events can be visually modeled as scaledomain manifolds (Figure 8.15). To visualize and model these domain structures,
we first define all annihilation events and then locate the center pixel of each
annihilation blob in a similar manner as previously defined for domain levels
(Section 8.3.1.2). That is, the center location (x, y) of the first annihilation event of
each hyperblob within the entire stack is defined as a unique set of domain points
regardless of the scale (t) that exists within the stack. Then the locations of the
second, third, and nth annihilation event of all other hyperblobs are similarly
isolated until the last possible event is defined. Delaunay triangulation is then
FIGURE 8.15 Colorized model of five scale-domain manifolds based on annihilation events
that have been extracted from a 200-layer SS stack (shown in Figure 8.4). The first scale models
1221 annihilation events, the second 152, the third 64, the fourth 28, and the final scale models
10 annihilation events. The original study site (panchromatic image 500xy) is shown on the
bottom to provide context.
DISCUSSION
161