

trees, and 0.447 g/cm
3 for hardwood broad-leaf trees. The values of plot aboveground forest carbon (tons per hectare, T/ha) are shown in Figure 6.1a.
A Landsat Enhanced TM Plus (ETM+) image dated August 3, 2004, was acquired
and it covered 80% of Lin-An County (Wang et al., 2011). The image consisted of
bands 1–5 and 7 that had a spatial resolution of 30 m ´ 30 m and was georeferenced to
the Universal Transverse Mercator (UTM) coordinate system based on a digital
topographic map and with a root mean-square error less than one pixel. The
radiometric correction of the image was neglected because of good atmospheric
condition when the image was acquired. In order to increase the Pearson product
moment correlation coefficients of the images with above-ground forest carbon,
various image transformations were conducted, including 6 inversions of original
bands—1/TM1, 1/TM2, 1/TM3, 1/TM4, 1/TM5, 1/TM7—and 10 band or band group
ratios—TM1/TM4, TM2/TM4, TM3/TM4, TM5/TM4, TM7/TM4, TM8/TM4,
(TM4-TM3)/(TM4+TM3), (TM3+TM5)/TM7, (TM3+TM5+TM7)/TM4, and
(TM2+TM3+TM5)/TM7. The significance of the coefficients was tested using
the equation
r a =
t n−2;1−a=2
ffiffiffiffiffiffiffiffiffiffiffiffiffiffiffiffiffiffiffiffiffiffiffiffiffiffiffiffiffiffiffiffiffiffiffiffiffiffiffiffi ffi
n − 2 + t 2
n − 2;1 − a=2
q
(6.3)
where n is the number of sample plots and a (=5%) is the significance level.
6.4 RESULTS
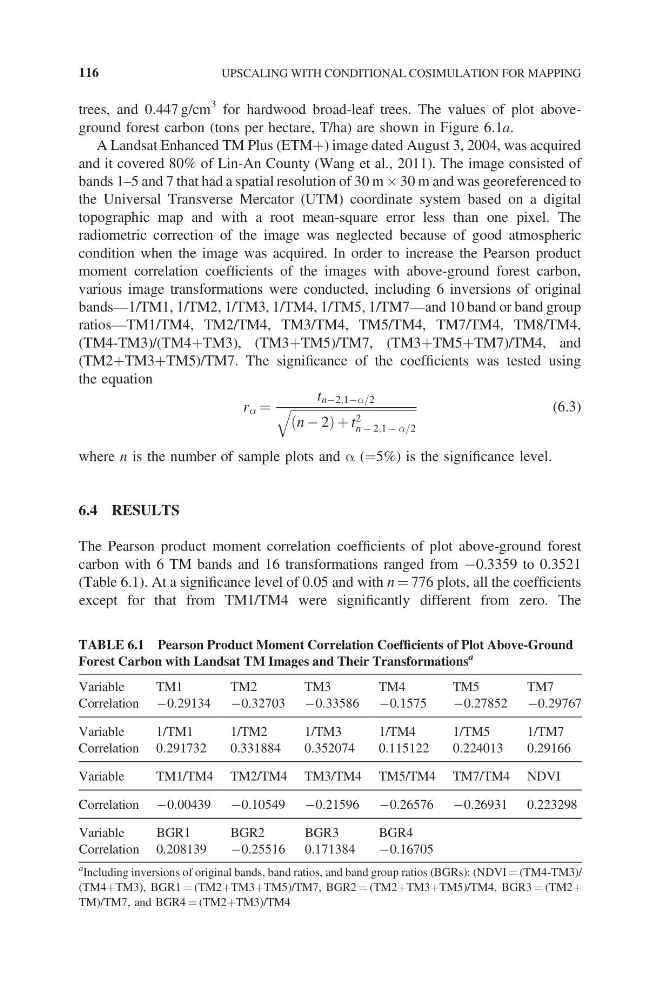
The Pearson product moment correlation coefficients of plot above-ground forest
carbon with 6 TM bands and 16 transformations ranged from −0.3359 to 0.3521
(Table 6.1). At a significance level of 0.05 and with n = 776 plots, all the coefficients
except for that from TM1/TM4 were significantly different from zero. The
TABLE 6.1 Pearson Product Moment Correlation Coefficients of Plot Above-Ground
Forest Carbon with Landsat TM Images and Their Transformations
a
Variable
TM1
TM2
TM3
TM4
TM5
TM7
Correlation −0.29134 −0.32703 −0.33586 −0.1575
−0.27852 −0.29767
Variable
1/TM1
1/TM2
1/TM3
1/TM4
1/TM5
1/TM7
Correlation 0.291732
0.331884
0.352074
0.115122
0.224013
0.29166
Variable
TM1/TM4 TM2/TM4 TM3/TM4 TM5/TM4 TM7/TM4 NDVI
Correlation −0.00439 −0.10549 −0.21596 −0.26576 −0.26931 0.223298
Variable
BGR1
BGR2
BGR3
BGR4
Correlation 0.208139
−0.25516 0.171384
−0.16705
a
Including inversions of original bands, band ratios, and band group ratios (BGRs): (NDVI = (TM4-TM3)/
(TM4+TM3), BGR1 = (TM2+TM3+TM5)/TM7, BGR2 = (TM2+TM3+TM5)/TM4, BGR3 = (TM2+
TM)/TM7, and BGR4 = (TM2+TM3)/TM4
116
UPSCALING WITH CONDITIONAL COSIMULATION FOR MAPPING
3 for hardwood broad-leaf trees. The values of plot aboveground forest carbon (tons per hectare, T/ha) are shown in Figure 6.1a.
A Landsat Enhanced TM Plus (ETM+) image dated August 3, 2004, was acquired
and it covered 80% of Lin-An County (Wang et al., 2011). The image consisted of
bands 1–5 and 7 that had a spatial resolution of 30 m ´ 30 m and was georeferenced to
the Universal Transverse Mercator (UTM) coordinate system based on a digital
topographic map and with a root mean-square error less than one pixel. The
radiometric correction of the image was neglected because of good atmospheric
condition when the image was acquired. In order to increase the Pearson product
moment correlation coefficients of the images with above-ground forest carbon,
various image transformations were conducted, including 6 inversions of original
bands—1/TM1, 1/TM2, 1/TM3, 1/TM4, 1/TM5, 1/TM7—and 10 band or band group
ratios—TM1/TM4, TM2/TM4, TM3/TM4, TM5/TM4, TM7/TM4, TM8/TM4,
(TM4-TM3)/(TM4+TM3), (TM3+TM5)/TM7, (TM3+TM5+TM7)/TM4, and
(TM2+TM3+TM5)/TM7. The significance of the coefficients was tested using
the equation
r a =
t n−2;1−a=2
ffiffiffiffiffiffiffiffiffiffiffiffiffiffiffiffiffiffiffiffiffiffiffiffiffiffiffiffiffiffiffiffiffiffiffiffiffiffiffiffi ffi
n − 2 + t 2
n − 2;1 − a=2
q
(6.3)
where n is the number of sample plots and a (=5%) is the significance level.
6.4 RESULTS
The Pearson product moment correlation coefficients of plot above-ground forest
carbon with 6 TM bands and 16 transformations ranged from −0.3359 to 0.3521
(Table 6.1). At a significance level of 0.05 and with n = 776 plots, all the coefficients
except for that from TM1/TM4 were significantly different from zero. The
TABLE 6.1 Pearson Product Moment Correlation Coefficients of Plot Above-Ground
Forest Carbon with Landsat TM Images and Their Transformations
a
Variable
TM1
TM2
TM3
TM4
TM5
TM7
Correlation −0.29134 −0.32703 −0.33586 −0.1575
−0.27852 −0.29767
Variable
1/TM1
1/TM2
1/TM3
1/TM4
1/TM5
1/TM7
Correlation 0.291732
0.331884
0.352074
0.115122
0.224013
0.29166
Variable
TM1/TM4 TM2/TM4 TM3/TM4 TM5/TM4 TM7/TM4 NDVI
Correlation −0.00439 −0.10549 −0.21596 −0.26576 −0.26931 0.223298
Variable
BGR1
BGR2
BGR3
BGR4
Correlation 0.208139
−0.25516 0.171384
−0.16705
a
Including inversions of original bands, band ratios, and band group ratios (BGRs): (NDVI = (TM4-TM3)/
(TM4+TM3), BGR1 = (TM2+TM3+TM5)/TM7, BGR2 = (TM2+TM3+TM5)/TM4, BGR3 = (TM2+
TM)/TM7, and BGR4 = (TM2+TM3)/TM4
116
UPSCALING WITH CONDITIONAL COSIMULATION FOR MAPPING