

atmospheric effects using one of several within-scene methods to account for effects
of haze and moisture content on light transmission through the atmosphere (Song
et al., 2001). Fortunately, a large body of literature is available on the use of Landsat
images for change detection, and differences in NDVI of <10% attributable to
vegetation changes between acquisition dates can be routinely detected (Gillanders
et al., 2008).
Landsat images are also widely used to estimate ET. Two types of methods have
been developed (Glenn et al., 2007): energy balance methods based on thermal band
measurements of surface temperature (reviewed in Kalma et al., 2008; Kustas and
Anderson, 2009) and VI estimates of ET by transpiring vegetation (reviewed in Glenn
et al., 2007, 2008, 2010). VI methods lend themselves to change detection studies for
three reasons:
1. They are based on the generally strong correlation between ET and vegetation
indices in a variety of natural and agricultural ecosystems, with many methods
producing coeffieints of determination (r
2
) in the range of 0.75–0.95.
2. They characterize differences in ET that can be attributed directly to changes in
foliage density between dates, which is the goal of this study.
3. They are easy to apply and do not require a large amount of ancillary ground
data (Glenn et al., 2010).
Although many variations exist, most VI methods for ET are based on the crop
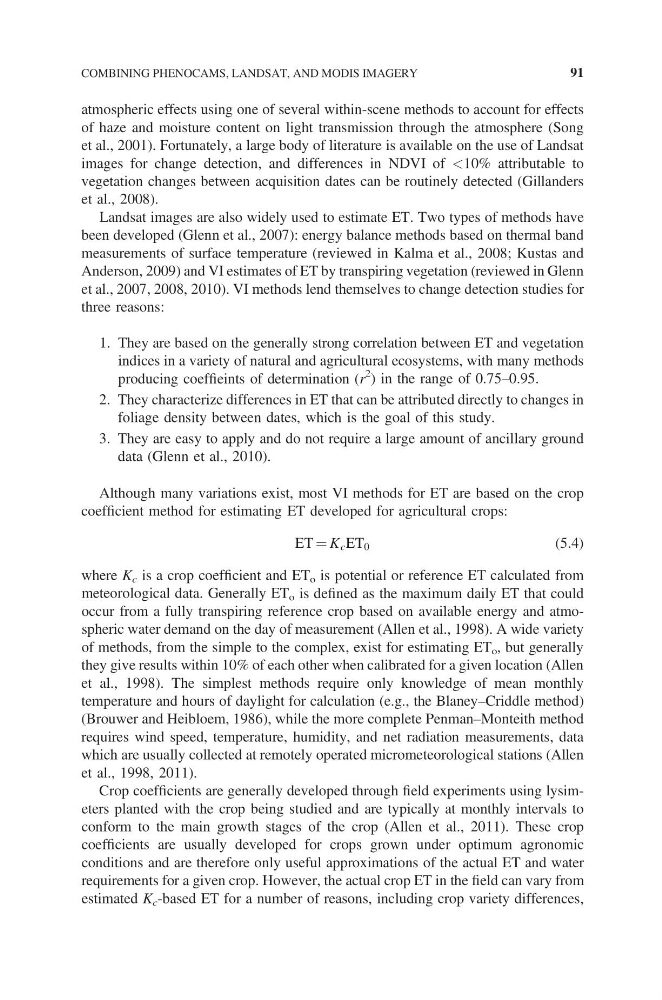
coefficient method for estimating ET developed for agricultural crops:
ET = K c ET 0
(5.4)
where K c is a crop coefficient and ET o is potential or reference ET calculated from
meteorological data. Generally ET o is defined as the maximum daily ET that could
occur from a fully transpiring reference crop based on available energy and atmospheric water demand on the day of measurement (Allen et al., 1998). A wide variety
of methods, from the simple to the complex, exist for estimating ET o , but generally
they give results within 10% of each other when calibrated for a given location (Allen
et al., 1998). The simplest methods require only knowledge of mean monthly
temperature and hours of daylight for calculation (e.g., the Blaney–Criddle method)
(Brouwer and Heibloem, 1986), while the more complete Penman–Monteith method
requires wind speed, temperature, humidity, and net radiation measurements, data
which are usually collected at remotely operated micrometeorological stations (Allen
et al., 1998, 2011).
Crop coefficients are generally developed through field experiments using lysimeters planted with the crop being studied and are typically at monthly intervals to
conform to the main growth stages of the crop (Allen et al., 2011). These crop
coefficients are usually developed for crops grown under optimum agronomic
conditions and are therefore only useful approximations of the actual ET and water
requirements for a given crop. However, the actual crop ET in the field can vary from
estimated K c -based ET for a number of reasons, including crop variety differences,
COMBINING PHENOCAMS, LANDSAT, AND MODIS IMAGERY
91
of haze and moisture content on light transmission through the atmosphere (Song
et al., 2001). Fortunately, a large body of literature is available on the use of Landsat
images for change detection, and differences in NDVI of <10% attributable to
vegetation changes between acquisition dates can be routinely detected (Gillanders
et al., 2008).
Landsat images are also widely used to estimate ET. Two types of methods have
been developed (Glenn et al., 2007): energy balance methods based on thermal band
measurements of surface temperature (reviewed in Kalma et al., 2008; Kustas and
Anderson, 2009) and VI estimates of ET by transpiring vegetation (reviewed in Glenn
et al., 2007, 2008, 2010). VI methods lend themselves to change detection studies for
three reasons:
1. They are based on the generally strong correlation between ET and vegetation
indices in a variety of natural and agricultural ecosystems, with many methods
producing coeffieints of determination (r
2
) in the range of 0.75–0.95.
2. They characterize differences in ET that can be attributed directly to changes in
foliage density between dates, which is the goal of this study.
3. They are easy to apply and do not require a large amount of ancillary ground
data (Glenn et al., 2010).
Although many variations exist, most VI methods for ET are based on the crop
coefficient method for estimating ET developed for agricultural crops:
ET = K c ET 0
(5.4)
where K c is a crop coefficient and ET o is potential or reference ET calculated from
meteorological data. Generally ET o is defined as the maximum daily ET that could
occur from a fully transpiring reference crop based on available energy and atmospheric water demand on the day of measurement (Allen et al., 1998). A wide variety
of methods, from the simple to the complex, exist for estimating ET o , but generally
they give results within 10% of each other when calibrated for a given location (Allen
et al., 1998). The simplest methods require only knowledge of mean monthly
temperature and hours of daylight for calculation (e.g., the Blaney–Criddle method)
(Brouwer and Heibloem, 1986), while the more complete Penman–Monteith method
requires wind speed, temperature, humidity, and net radiation measurements, data
which are usually collected at remotely operated micrometeorological stations (Allen
et al., 1998, 2011).
Crop coefficients are generally developed through field experiments using lysimeters planted with the crop being studied and are typically at monthly intervals to
conform to the main growth stages of the crop (Allen et al., 2011). These crop
coefficients are usually developed for crops grown under optimum agronomic
conditions and are therefore only useful approximations of the actual ET and water
requirements for a given crop. However, the actual crop ET in the field can vary from
estimated K c -based ET for a number of reasons, including crop variety differences,
COMBINING PHENOCAMS, LANDSAT, AND MODIS IMAGERY
91