

summer to determine if shrubs progressively weaken over years. We installed
multiple high-resolution, wireless panchromatic and infrared cameras on 10-m towers
at the University of Utah’s Rio Mesa field station in northeastern Utah, an early site of
Tamarix defoliation by leaf beetles, and on the Virgin River, near Mesquite, Nevada,
one of the most recent rivers to experience defoliation. Cameras included nadirmounted cameras trained on a 1-m
2 section of a shrub as well as wide-angle views
encompassing several hundred square meters. Camera images were uploaded via a
satellite Internet connection permitting us to monitor beetle and Tamarix impacts on
riparian ecology and water usage in real time. All data were uploaded to servers where
they could be viewed in near-real time using interactive software that allowed retrieval
of individual images and summary graphs of trends in NDVI and fractional green
cover over time.
Sensors were not intercalibrated and red and NIR DN values and consequently
NDVI varied considerably between the cameras and NDVIs were negative in
some cases. To produce a temporal data set responsive to changes in Tamarix
canopy condition, NDVI was calculated, averaged, and scaled using the following
steps:
1. A seven-day running average of all pixels within a subset area of the camera
field of view (∼1 m
2
) was calculated.
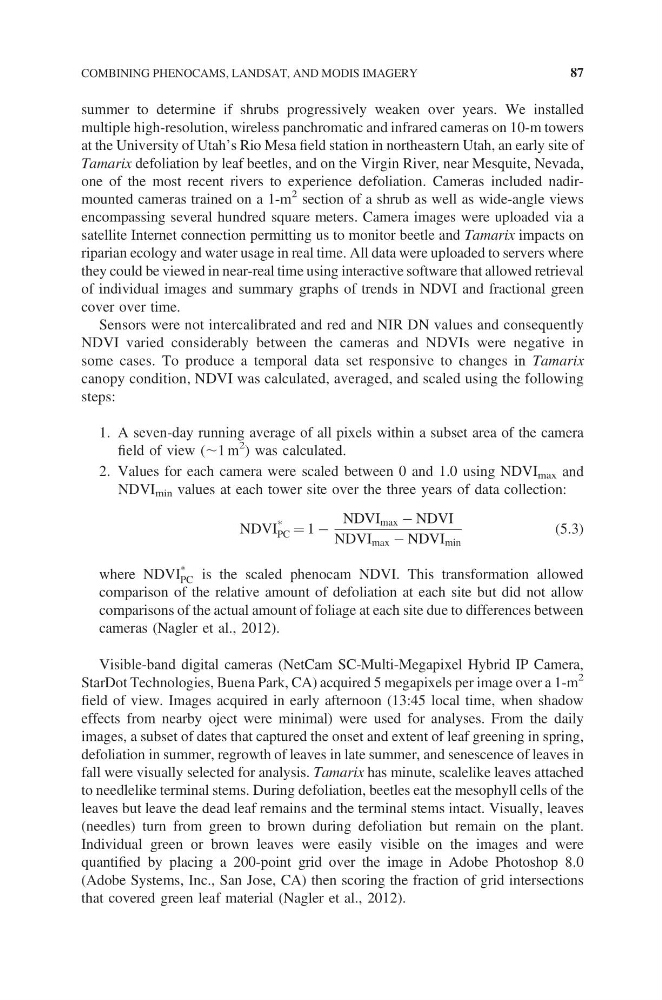
2. Values for each camera were scaled between 0 and 1.0 using NDVI max and
NDVI min values at each tower site over the three years of data collection:
NDVI
*
PC = 1 −
NDVI max − NDVI
NDVI max − NDVI min
(5.3)
where NDVI *
PC is the scaled phenocam NDVI. This transformation allowed
comparison of the relative amount of defoliation at each site but did not allow
comparisons of the actual amount of foliage at each site due to differences between
cameras (Nagler et al., 2012).
Visible-band digital cameras (NetCam SC-Multi-Megapixel Hybrid IP Camera,
StarDot Technologies, Buena Park, CA) acquired 5 megapixels per image over a 1-m
2
field of view. Images acquired in early afternoon (13:45 local time, when shadow
effects from nearby oject were minimal) were used for analyses. From the daily
images, a subset of dates that captured the onset and extent of leaf greening in spring,
defoliation in summer, regrowth of leaves in late summer, and senescence of leaves in
fall were visually selected for analysis. Tamarix has minute, scalelike leaves attached
to needlelike terminal stems. During defoliation, beetles eat the mesophyll cells of the
leaves but leave the dead leaf remains and the terminal stems intact. Visually, leaves
(needles) turn from green to brown during defoliation but remain on the plant.
Individual green or brown leaves were easily visible on the images and were
quantified by placing a 200-point grid over the image in Adobe Photoshop 8.0
(Adobe Systems, Inc., San Jose, CA) then scoring the fraction of grid intersections
that covered green leaf material (Nagler et al., 2012).
COMBINING PHENOCAMS, LANDSAT, AND MODIS IMAGERY
87
multiple high-resolution, wireless panchromatic and infrared cameras on 10-m towers
at the University of Utah’s Rio Mesa field station in northeastern Utah, an early site of
Tamarix defoliation by leaf beetles, and on the Virgin River, near Mesquite, Nevada,
one of the most recent rivers to experience defoliation. Cameras included nadirmounted cameras trained on a 1-m
2 section of a shrub as well as wide-angle views
encompassing several hundred square meters. Camera images were uploaded via a
satellite Internet connection permitting us to monitor beetle and Tamarix impacts on
riparian ecology and water usage in real time. All data were uploaded to servers where
they could be viewed in near-real time using interactive software that allowed retrieval
of individual images and summary graphs of trends in NDVI and fractional green
cover over time.
Sensors were not intercalibrated and red and NIR DN values and consequently
NDVI varied considerably between the cameras and NDVIs were negative in
some cases. To produce a temporal data set responsive to changes in Tamarix
canopy condition, NDVI was calculated, averaged, and scaled using the following
steps:
1. A seven-day running average of all pixels within a subset area of the camera
field of view (∼1 m
2
) was calculated.
2. Values for each camera were scaled between 0 and 1.0 using NDVI max and
NDVI min values at each tower site over the three years of data collection:
NDVI
*
PC = 1 −
NDVI max − NDVI
NDVI max − NDVI min
(5.3)
where NDVI *
PC is the scaled phenocam NDVI. This transformation allowed
comparison of the relative amount of defoliation at each site but did not allow
comparisons of the actual amount of foliage at each site due to differences between
cameras (Nagler et al., 2012).
Visible-band digital cameras (NetCam SC-Multi-Megapixel Hybrid IP Camera,
StarDot Technologies, Buena Park, CA) acquired 5 megapixels per image over a 1-m
2
field of view. Images acquired in early afternoon (13:45 local time, when shadow
effects from nearby oject were minimal) were used for analyses. From the daily
images, a subset of dates that captured the onset and extent of leaf greening in spring,
defoliation in summer, regrowth of leaves in late summer, and senescence of leaves in
fall were visually selected for analysis. Tamarix has minute, scalelike leaves attached
to needlelike terminal stems. During defoliation, beetles eat the mesophyll cells of the
leaves but leave the dead leaf remains and the terminal stems intact. Visually, leaves
(needles) turn from green to brown during defoliation but remain on the plant.
Individual green or brown leaves were easily visible on the images and were
quantified by placing a 200-point grid over the image in Adobe Photoshop 8.0
(Adobe Systems, Inc., San Jose, CA) then scoring the fraction of grid intersections
that covered green leaf material (Nagler et al., 2012).
COMBINING PHENOCAMS, LANDSAT, AND MODIS IMAGERY
87