

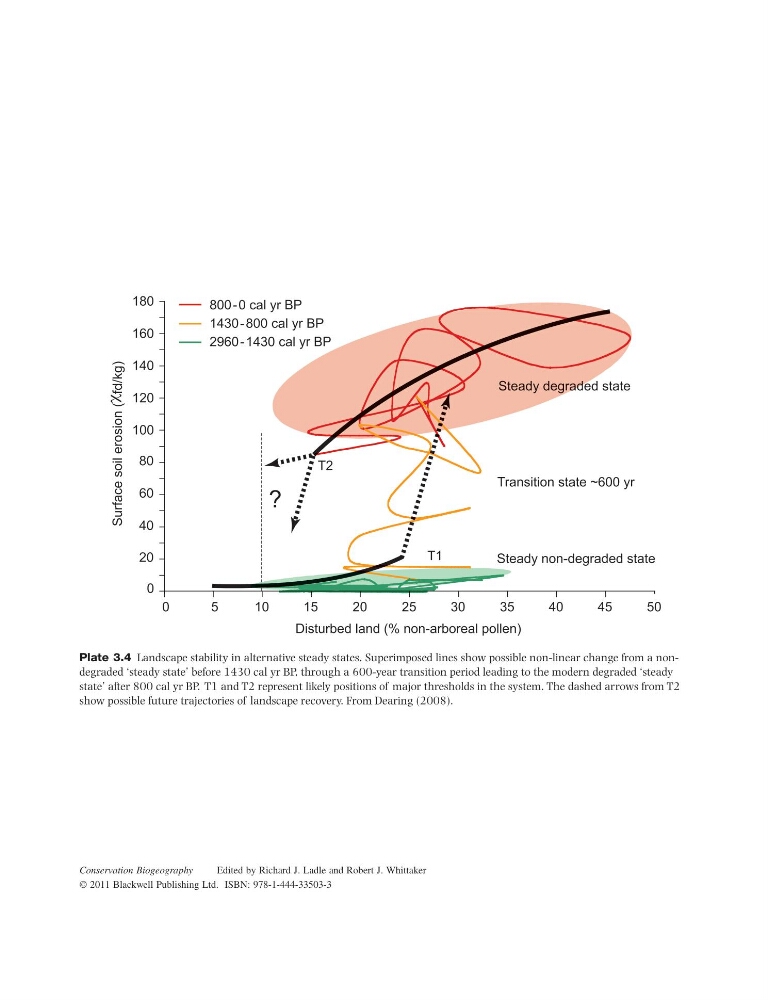
Plate 3.4 Landscape stability in alternative steady states. Superimposed lines show possible non-linear change from a nondegraded ‘steady state’ before 1430 cal yr BP, through a 600-year transition period leading to the modern degraded ‘steady
state’ after 800 cal yr BP. T1 and T2 represent likely positions of major thresholds in the system. The dashed arrows from T2
show possible future trajectories of landscape recovery. From Dearing (2008).
Conservation Biogeography
Edited by Richard J. Ladle and Robert J. Whittaker
© 2011 Blackwell Publishing Ltd. ISBN: 978-1-444-33503-3
state’ after 800 cal yr BP. T1 and T2 represent likely positions of major thresholds in the system. The dashed arrows from T2
show possible future trajectories of landscape recovery. From Dearing (2008).
Conservation Biogeography
Edited by Richard J. Ladle and Robert J. Whittaker
© 2011 Blackwell Publishing Ltd. ISBN: 978-1-444-33503-3