

214
Applied island biogeography
Table 8.3 Causes of nested subset patterns (adapted from Ulrich et al. , 2009 ) .
Hypothesis
Assumption/precondition
Explanation/Example
Site and species
properties
Gradient of:
Passive
sampling
carrying capacities
of sites
regional
abundance
Species are drawn randomly from the pool with the
constraint that the availability of propagules is itself
strongly non - random (e.g. Higgins et al. , 2006 ).
Neutrality
carrying capacities
of sites
dispersal
ability
The availability of propagules is random and
species ’ dispersal ability is driving the pattern (e.g.
Ulrich & Zalewski, 2007 ).
Selective
colonization
isolation
dispersal
ability
There are predictable limits to species ’ dispersal
abilities. The system consists of islands ‘ sampling ’
a series of species ’ isolation/incidence functions
(e.g. Darlington, 1957 ; Patterson, 1990 ).
Selective
extinction
carrying capacities
of sites
extinction
susceptibility
Selective occupancy of sites according to the area
of sites, which sets their carrying capacity.
Relaxation in the case of mainland/habitat islands
(e.g. Patterson & Atmar, 1986 ).
Nested habitats
habitat
heterogeneity
degrees of
specialization
Absence of certain habitat types in smaller and/or
resource - poor patches. Higher proportion of
generalist species in smaller and/or resource - poor
patches (Wright & Reeves, 1992 ).
Selective
environmental
tolerances
environmental
harshness,
environmental
tolerances
Selective occupancy of sites according to species
tolerance of environmental stress (e.g. Blake, 1991 ).
Habitat quality
environmental
harshness
Species are distributed according to the harshness
exhibited by patches of the same habitat (e.g.
Bloch et al. , 2007 ).
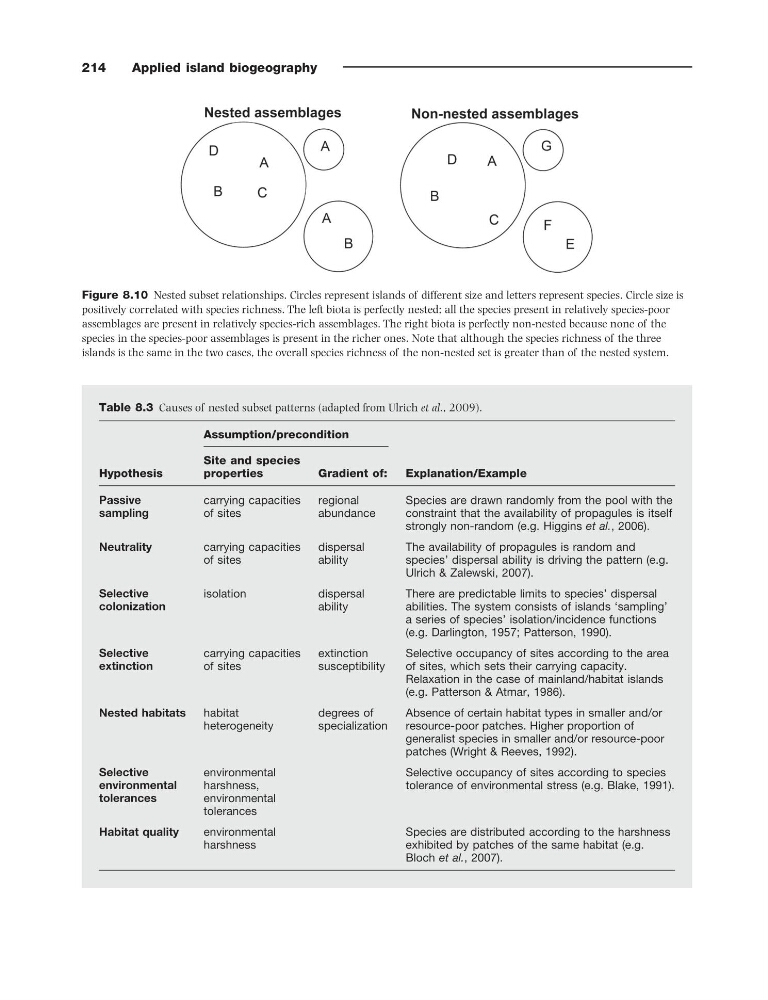
Figure 8.10 Nested subset relationships. Circles represent islands of different size and letters represent species. Circle size is
positively correlated with species richness. The left biota is perfectly nested; all the species present in relatively species - poor
assemblages are present in relatively species - rich assemblages. The right biota is perfectly non - nested because none of the
species in the species - poor assemblages is present in the richer ones. Note that although the species richness of the three
islands is the same in the two cases, the overall species richness of the non - nested set is greater than of the nested system.
Applied island biogeography
Table 8.3 Causes of nested subset patterns (adapted from Ulrich et al. , 2009 ) .
Hypothesis
Assumption/precondition
Explanation/Example
Site and species
properties
Gradient of:
Passive
sampling
carrying capacities
of sites
regional
abundance
Species are drawn randomly from the pool with the
constraint that the availability of propagules is itself
strongly non - random (e.g. Higgins et al. , 2006 ).
Neutrality
carrying capacities
of sites
dispersal
ability
The availability of propagules is random and
species ’ dispersal ability is driving the pattern (e.g.
Ulrich & Zalewski, 2007 ).
Selective
colonization
isolation
dispersal
ability
There are predictable limits to species ’ dispersal
abilities. The system consists of islands ‘ sampling ’
a series of species ’ isolation/incidence functions
(e.g. Darlington, 1957 ; Patterson, 1990 ).
Selective
extinction
carrying capacities
of sites
extinction
susceptibility
Selective occupancy of sites according to the area
of sites, which sets their carrying capacity.
Relaxation in the case of mainland/habitat islands
(e.g. Patterson & Atmar, 1986 ).
Nested habitats
habitat
heterogeneity
degrees of
specialization
Absence of certain habitat types in smaller and/or
resource - poor patches. Higher proportion of
generalist species in smaller and/or resource - poor
patches (Wright & Reeves, 1992 ).
Selective
environmental
tolerances
environmental
harshness,
environmental
tolerances
Selective occupancy of sites according to species
tolerance of environmental stress (e.g. Blake, 1991 ).
Habitat quality
environmental
harshness
Species are distributed according to the harshness
exhibited by patches of the same habitat (e.g.
Bloch et al. , 2007 ).
Figure 8.10 Nested subset relationships. Circles represent islands of different size and letters represent species. Circle size is
positively correlated with species richness. The left biota is perfectly nested; all the species present in relatively species - poor
assemblages are present in relatively species - rich assemblages. The right biota is perfectly non - nested because none of the
species in the species - poor assemblages is present in the richer ones. Note that although the species richness of the three
islands is the same in the two cases, the overall species richness of the non - nested set is greater than of the nested system.