

Conservation planning in a changing world
187
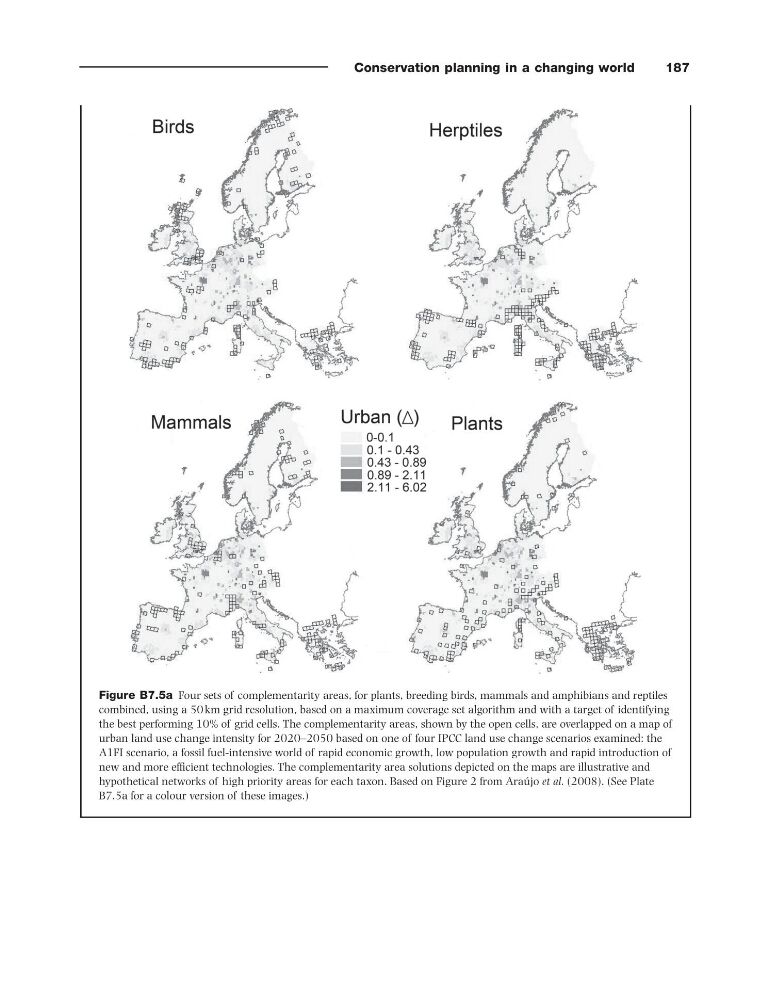
Figure B7.5a Four sets of complementarity areas, for plants, breeding birds, mammals and amphibians and reptiles
combined, using a 50 km grid resolution, based on a maximum coverage set algorithm and with a target of identifying
the best performing 10% of grid cells. The complementarity areas, shown by the open cells, are overlapped on a map of
urban land use change intensity for 2020 – 2050 based on one of four IPCC land use change scenarios examined: the
A1FI scenario, a fossil fuel - intensive world of rapid economic growth, low population growth and rapid introduction of
new and more effi cient technologies. The complementarity area solutions depicted on the maps are illustrative and
hypothetical networks of high priority areas for each taxon. Based on Figure 2 from Ara ú jo et al. (2008) . (See Plate
B7.5a for a colour version of these images.)
187
Figure B7.5a Four sets of complementarity areas, for plants, breeding birds, mammals and amphibians and reptiles
combined, using a 50 km grid resolution, based on a maximum coverage set algorithm and with a target of identifying
the best performing 10% of grid cells. The complementarity areas, shown by the open cells, are overlapped on a map of
urban land use change intensity for 2020 – 2050 based on one of four IPCC land use change scenarios examined: the
A1FI scenario, a fossil fuel - intensive world of rapid economic growth, low population growth and rapid introduction of
new and more effi cient technologies. The complementarity area solutions depicted on the maps are illustrative and
hypothetical networks of high priority areas for each taxon. Based on Figure 2 from Ara ú jo et al. (2008) . (See Plate
B7.5a for a colour version of these images.)