

182
Planning for persistence in a changing world
i assessing changes in the summed distribution areas of all species;
ii calculating the average proportional loss of the distribution area of each species to estimate the
fraction of species predicted to become extinct;
iii estimating the extinction risk of each species separately by substituting its area loss in the
species – area relationship before averaging across species.
They concluded that, under mid - range climate warming scenarios for 2050, somewhere between
15 – 37 per cent of the 1,103 species in their sample of regions and taxa would be ‘ committed to
extinction ’ . When the average of the three extinction probability calculation methods and two dispersal scenarios (universal dispersal or no dispersal) was used, minimal climate warming scenarios
produced lower projections of species committed to extinction (18 per cent) than mid - range (24 per
cent) and maximum change (35 per cent) scenarios.
The worldwide media interest stemmed from the implicit assumption that the taxa are representative of all terrestrial animals, and that therefore 15 – 37 per cent of all terrestrial species would be
committed to extinction by 2050 (reviewed in Ladle et al ., 2004, 2005 ). In fact, the 1,103 species
selected for the study were all endemics whose ranges are restricted to relatively small regions.
Such range - restricted taxa are likely to experience a relatively limited range of climates, and, by
extrapolation, their climate envelopes are more likely to disappear as conditions change. Moreover,
the doubts about the predictive ability of such models reviewed in this chapter and in Section 4.4.1
mean that all such projections have to be treated with a healthy degree of scientifi c caution.
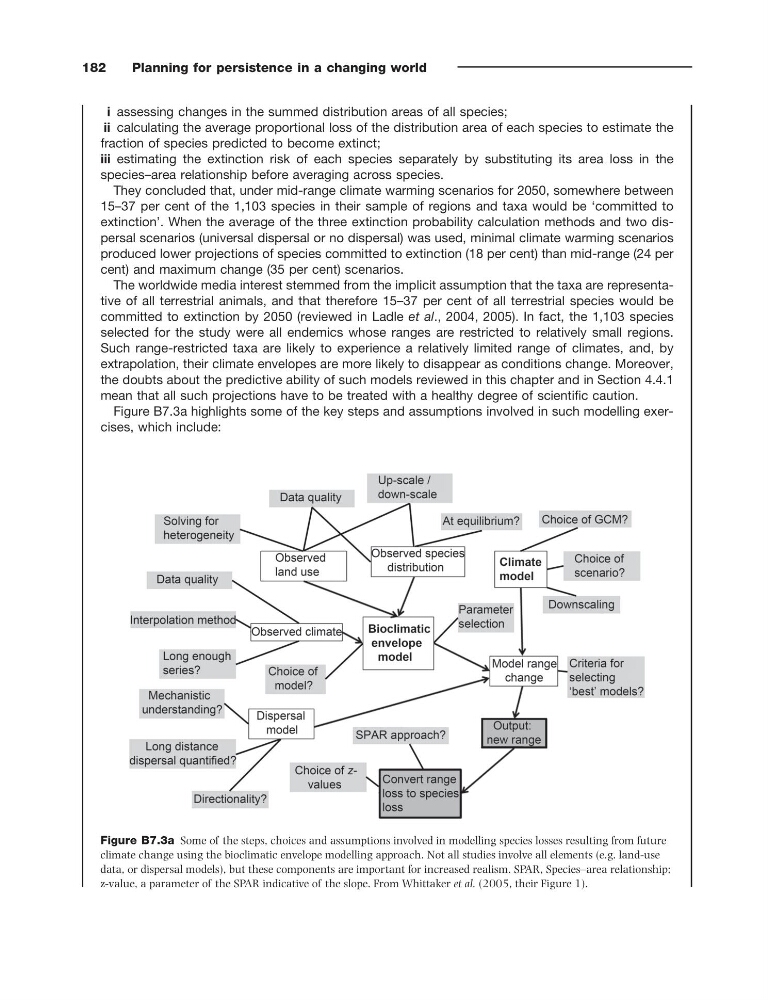
Figure B7.3a highlights some of the key steps and assumptions involved in such modelling exercises, which include:
Figure B7.3a Some of the steps, choices and assumptions involved in modelling species losses resulting from future
climate change using the bioclimatic envelope modelling approach. Not all studies involve all elements (e.g. land - use
data, or dispersal models), but these components are important for increased realism. SPAR, Species – area relationship;
z - value, a parameter of the SPAR indicative of the slope. From Whittaker et al. ( 2005 , their Figure 1).
Planning for persistence in a changing world
i assessing changes in the summed distribution areas of all species;
ii calculating the average proportional loss of the distribution area of each species to estimate the
fraction of species predicted to become extinct;
iii estimating the extinction risk of each species separately by substituting its area loss in the
species – area relationship before averaging across species.
They concluded that, under mid - range climate warming scenarios for 2050, somewhere between
15 – 37 per cent of the 1,103 species in their sample of regions and taxa would be ‘ committed to
extinction ’ . When the average of the three extinction probability calculation methods and two dispersal scenarios (universal dispersal or no dispersal) was used, minimal climate warming scenarios
produced lower projections of species committed to extinction (18 per cent) than mid - range (24 per
cent) and maximum change (35 per cent) scenarios.
The worldwide media interest stemmed from the implicit assumption that the taxa are representative of all terrestrial animals, and that therefore 15 – 37 per cent of all terrestrial species would be
committed to extinction by 2050 (reviewed in Ladle et al ., 2004, 2005 ). In fact, the 1,103 species
selected for the study were all endemics whose ranges are restricted to relatively small regions.
Such range - restricted taxa are likely to experience a relatively limited range of climates, and, by
extrapolation, their climate envelopes are more likely to disappear as conditions change. Moreover,
the doubts about the predictive ability of such models reviewed in this chapter and in Section 4.4.1
mean that all such projections have to be treated with a healthy degree of scientifi c caution.
Figure B7.3a highlights some of the key steps and assumptions involved in such modelling exercises, which include:
Figure B7.3a Some of the steps, choices and assumptions involved in modelling species losses resulting from future
climate change using the bioclimatic envelope modelling approach. Not all studies involve all elements (e.g. land - use
data, or dispersal models), but these components are important for increased realism. SPAR, Species – area relationship;
z - value, a parameter of the SPAR indicative of the slope. From Whittaker et al. ( 2005 , their Figure 1).