

Conservation planning in a changing world
177
hypothetical 20 - year period. At each time step, they
constructed a conservation plan aimed at protecting
the most important areas of protea habitat. Results
showed that one could produce a robust conservation
plan using only two years ’ worth of survey data to
generate models of the distributions of proteas across
South Africa. This illustrates the power of species distribution models to inform conservation planning
efforts in the face of incomplete knowledge.
There are three broad routes to modelling the distributions of species (Graham & Hijmans, 2006 ; Gaston
& Fuller, 2009 ): those based simply on documenting
the pattern of a spatial distribution from known information; those that correlate a distribution with other
(external) variables; and those that build explicit
models of why a species occurs where it does. We will
refer to these kinds of methods as pattern - based, correlative, and process - based, respectively. One can only
use correlative or process - based models to predict
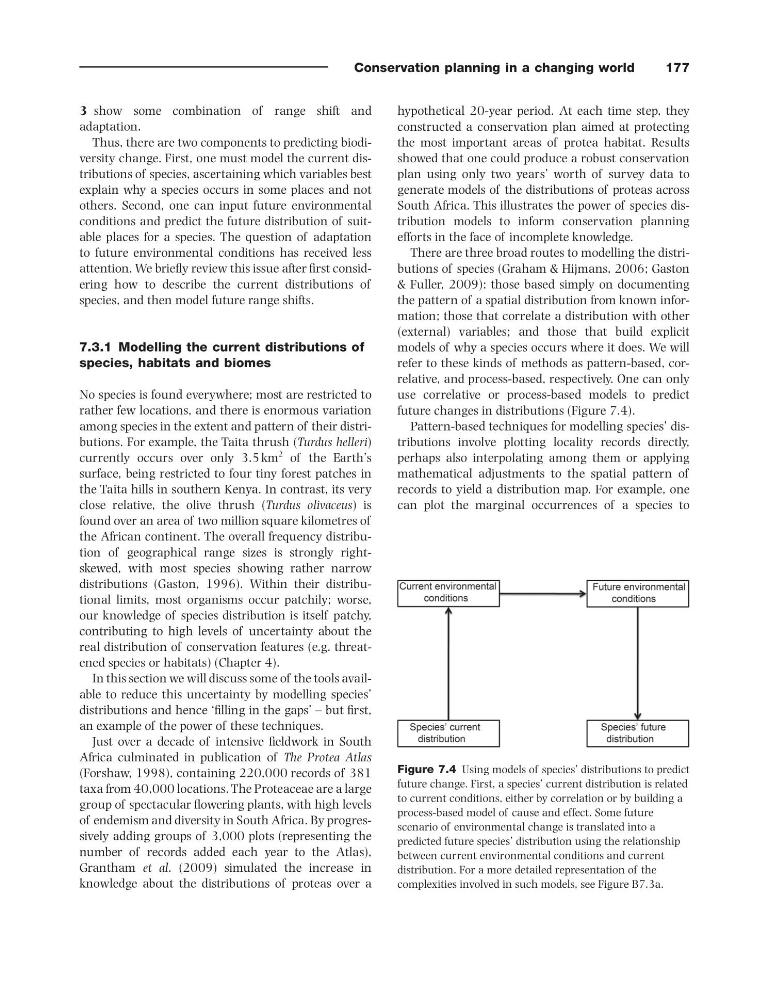
future changes in distributions (Figure 7.4 ).
Pattern - based techniques for modelling species ’ distributions involve plotting locality records directly,
perhaps also interpolating among them or applying
mathematical adjustments to the spatial pattern of
records to yield a distribution map. For example, one
can plot the marginal occurrences of a species to
3 show some combination of range shift and
adaptation.
Thus, there are two components to predicting biodiversity change. First, one must model the current distributions of species, ascertaining which variables best
explain why a species occurs in some places and not
others. Second, one can input future environmental
conditions and predict the future distribution of suitable places for a species. The question of adaptation
to future environmental conditions has received less
attention. We briefl y review this issue after fi rst considering how to describe the current distributions of
species, and then model future range shifts.
7.3.1 Modelling the c urrent d istributions of
s pecies, h abitats and b iomes
No species is found everywhere; most are restricted to
rather few locations, and there is enormous variation
among species in the extent and pattern of their distributions. For example, the Taita thrush ( Turdus helleri )
currently occurs over only 3.5 km
2 of the Earth ’ s
surface, being restricted to four tiny forest patches in
the Taita hills in southern Kenya. In contrast, its very
close relative, the olive thrush ( Turdus olivaceus ) is
found over an area of two million square kilometres of
the African continent. The overall frequency distribution of geographical range sizes is strongly right -
skewed, with most species showing rather narrow
distributions (Gaston, 1996 ). Within their distributional limits, most organisms occur patchily; worse,
our knowledge of species distribution is itself patchy,
contributing to high levels of uncertainty about the
real distribution of conservation features (e.g. threatened species or habitats) (Chapter 4 ).
In this section we will discuss some of the tools available to reduce this uncertainty by modelling species ’
distributions and hence ‘ fi lling in the gaps ’ – but fi rst,
an example of the power of these techniques.
Just over a decade of intensive fi eldwork in South
Africa culminated in publication of The Protea Atlas
(Forshaw, 1998 ), containing 220,000 records of 381
taxa from 40,000 locations. The Proteaceae are a large
group of spectacular fl owering plants, with high levels
of endemism and diversity in South Africa. By progressively adding groups of 3,000 plots (representing the
number of records added each year to the Atlas),
Grantham et al . (2009) simulated the increase in
knowledge about the distributions of proteas over a
Figure 7.4 Using models of species ’ distributions to predict
future change. First, a species ’ current distribution is related
to current conditions, either by correlation or by building a
process - based model of cause and effect. Some future
scenario of environmental change is translated into a
predicted future species ’ distribution using the relationship
between current environmental conditions and current
distribution. For a more detailed representation of the
complexities involved in such models, see Figure B7.3a .
177
hypothetical 20 - year period. At each time step, they
constructed a conservation plan aimed at protecting
the most important areas of protea habitat. Results
showed that one could produce a robust conservation
plan using only two years ’ worth of survey data to
generate models of the distributions of proteas across
South Africa. This illustrates the power of species distribution models to inform conservation planning
efforts in the face of incomplete knowledge.
There are three broad routes to modelling the distributions of species (Graham & Hijmans, 2006 ; Gaston
& Fuller, 2009 ): those based simply on documenting
the pattern of a spatial distribution from known information; those that correlate a distribution with other
(external) variables; and those that build explicit
models of why a species occurs where it does. We will
refer to these kinds of methods as pattern - based, correlative, and process - based, respectively. One can only
use correlative or process - based models to predict
future changes in distributions (Figure 7.4 ).
Pattern - based techniques for modelling species ’ distributions involve plotting locality records directly,
perhaps also interpolating among them or applying
mathematical adjustments to the spatial pattern of
records to yield a distribution map. For example, one
can plot the marginal occurrences of a species to
3 show some combination of range shift and
adaptation.
Thus, there are two components to predicting biodiversity change. First, one must model the current distributions of species, ascertaining which variables best
explain why a species occurs in some places and not
others. Second, one can input future environmental
conditions and predict the future distribution of suitable places for a species. The question of adaptation
to future environmental conditions has received less
attention. We briefl y review this issue after fi rst considering how to describe the current distributions of
species, and then model future range shifts.
7.3.1 Modelling the c urrent d istributions of
s pecies, h abitats and b iomes
No species is found everywhere; most are restricted to
rather few locations, and there is enormous variation
among species in the extent and pattern of their distributions. For example, the Taita thrush ( Turdus helleri )
currently occurs over only 3.5 km
2 of the Earth ’ s
surface, being restricted to four tiny forest patches in
the Taita hills in southern Kenya. In contrast, its very
close relative, the olive thrush ( Turdus olivaceus ) is
found over an area of two million square kilometres of
the African continent. The overall frequency distribution of geographical range sizes is strongly right -
skewed, with most species showing rather narrow
distributions (Gaston, 1996 ). Within their distributional limits, most organisms occur patchily; worse,
our knowledge of species distribution is itself patchy,
contributing to high levels of uncertainty about the
real distribution of conservation features (e.g. threatened species or habitats) (Chapter 4 ).
In this section we will discuss some of the tools available to reduce this uncertainty by modelling species ’
distributions and hence ‘ fi lling in the gaps ’ – but fi rst,
an example of the power of these techniques.
Just over a decade of intensive fi eldwork in South
Africa culminated in publication of The Protea Atlas
(Forshaw, 1998 ), containing 220,000 records of 381
taxa from 40,000 locations. The Proteaceae are a large
group of spectacular fl owering plants, with high levels
of endemism and diversity in South Africa. By progressively adding groups of 3,000 plots (representing the
number of records added each year to the Atlas),
Grantham et al . (2009) simulated the increase in
knowledge about the distributions of proteas over a
Figure 7.4 Using models of species ’ distributions to predict
future change. First, a species ’ current distribution is related
to current conditions, either by correlation or by building a
process - based model of cause and effect. Some future
scenario of environmental change is translated into a
predicted future species ’ distribution using the relationship
between current environmental conditions and current
distribution. For a more detailed representation of the
complexities involved in such models, see Figure B7.3a .