

170
Planning for persistence in a changing world
distributions is key to predicting how those distributions will change in the future. However, interpreting
the magnitude of recent changes requires comparison
to some baselines, and there are many that could be
selected (Gillson & Willis, 2004 ; Birks, 2005 ; Smol
et al. , 2005 ; Willis & Birks 2006 ; Willis et al. , 2007 ).
Willis et al . (2007) suggest using changes in environmental regimes as a guide to identifying baselines (e.g.
the Holocene shift to warm climatic conditions that
persist today). However, while the use of long - term
ecological data may improve the rigour and objectivity
of the process, the choice of which baseline to adopt is,
ultimately, a subjective one (see Chapter 3 for a fuller
discussion of ecological baselines). Whatever the
choice of baseline, many of the issues of using the past
to understand the present and predict the future
remain the same.
7.2.3 Geographical r ange c ollapse
The distributions of species do not remain constant
over time; in reality, they are highly dynamic over all
but the narrowest of timescales (Gaston, 2003 ;
Lomolino et al. , 2010 ). Geographical range shifts over
time have been documented empirically using the fossil
increased signifi cantly in the early 1800s due to agricultural changes (Holloway, 1996 ) but have declined
sharply in the last few decades, largely due to increased
use of pesticides, such that the species is now Red Listed
in the UK (Potts, 1986 ; Gregory et al. , 2002 ).
An example of major changes in community composition over more recent history involves the colonization of urban environments by species (Blair, 1996 ;
Johnston, 2001 ). Some species, termed synanthropic,
or urban exploiters, are able to thrive in the novel conditions created as a landscape is urbanized. For
example, although once confi ned to forest habitats, the
Eurasian blackbird ( Turdus merula ) has now colonized
towns and cities across most of the European part of
its geographical range, with the phenomenon being
fi rst noted in Germany in the 1820s (Luniak et al. ,
1990 ). Genetic analysis of blackbirds from 12 cities
supports the hypothesis that birds colonized each of
the cities in separate colonization events, rather than
‘ leapfrogging ’ from one city to another (Evans et al. ,
2009 ). This is an elegant example of how contemporary genetic analysis can be used to piece together the
historical pattern of spread of a species.
The foregoing examples show that understanding
how the dynamic processes of extinction and colonization have led to present patterns in species ’
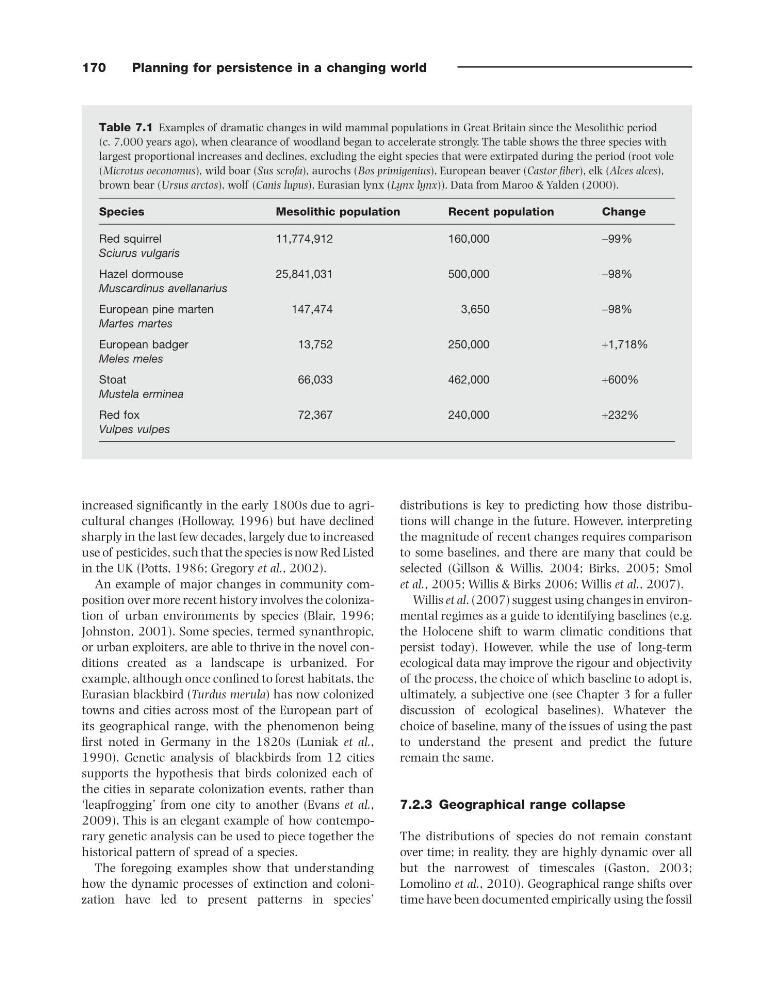
Table 7.1 Examples of dramatic changes in wild mammal populations in Great Britain since the Mesolithic period
(c. 7,000 years ago), when clearance of woodland began to accelerate strongly. The table shows the three species with
largest proportional increases and declines, excluding the eight species that were extirpated during the period (root vole
( Microtus oeconomus ), wild boar ( Sus scrofa ), aurochs ( Bos primigenius ), European beaver ( Castor fi ber ), elk ( Alces alces ),
brown bear ( Ursus arctos ), wolf ( Canis lupus ), Eurasian lynx ( Lynx lynx )). Data from Maroo & Yalden (2000) .
Species
Mesolithic population
Recent population
Change
Red squirrel
Sciurus vulgaris
11,774,912
160,000
− 99%
Hazel dormouse
Muscardinus avellanarius
25,841,031
500,000
− 98%
European pine marten
Martes martes
147,474
3,650
− 98%
European badger
Meles meles
13,752
250,000
+ 1,718%
Stoat
Mustela erminea
66,033
462,000
+ 600%
Red fox
Vulpes vulpes
72,367
240,000
+ 232%
Planning for persistence in a changing world
distributions is key to predicting how those distributions will change in the future. However, interpreting
the magnitude of recent changes requires comparison
to some baselines, and there are many that could be
selected (Gillson & Willis, 2004 ; Birks, 2005 ; Smol
et al. , 2005 ; Willis & Birks 2006 ; Willis et al. , 2007 ).
Willis et al . (2007) suggest using changes in environmental regimes as a guide to identifying baselines (e.g.
the Holocene shift to warm climatic conditions that
persist today). However, while the use of long - term
ecological data may improve the rigour and objectivity
of the process, the choice of which baseline to adopt is,
ultimately, a subjective one (see Chapter 3 for a fuller
discussion of ecological baselines). Whatever the
choice of baseline, many of the issues of using the past
to understand the present and predict the future
remain the same.
7.2.3 Geographical r ange c ollapse
The distributions of species do not remain constant
over time; in reality, they are highly dynamic over all
but the narrowest of timescales (Gaston, 2003 ;
Lomolino et al. , 2010 ). Geographical range shifts over
time have been documented empirically using the fossil
increased signifi cantly in the early 1800s due to agricultural changes (Holloway, 1996 ) but have declined
sharply in the last few decades, largely due to increased
use of pesticides, such that the species is now Red Listed
in the UK (Potts, 1986 ; Gregory et al. , 2002 ).
An example of major changes in community composition over more recent history involves the colonization of urban environments by species (Blair, 1996 ;
Johnston, 2001 ). Some species, termed synanthropic,
or urban exploiters, are able to thrive in the novel conditions created as a landscape is urbanized. For
example, although once confi ned to forest habitats, the
Eurasian blackbird ( Turdus merula ) has now colonized
towns and cities across most of the European part of
its geographical range, with the phenomenon being
fi rst noted in Germany in the 1820s (Luniak et al. ,
1990 ). Genetic analysis of blackbirds from 12 cities
supports the hypothesis that birds colonized each of
the cities in separate colonization events, rather than
‘ leapfrogging ’ from one city to another (Evans et al. ,
2009 ). This is an elegant example of how contemporary genetic analysis can be used to piece together the
historical pattern of spread of a species.
The foregoing examples show that understanding
how the dynamic processes of extinction and colonization have led to present patterns in species ’
Table 7.1 Examples of dramatic changes in wild mammal populations in Great Britain since the Mesolithic period
(c. 7,000 years ago), when clearance of woodland began to accelerate strongly. The table shows the three species with
largest proportional increases and declines, excluding the eight species that were extirpated during the period (root vole
( Microtus oeconomus ), wild boar ( Sus scrofa ), aurochs ( Bos primigenius ), European beaver ( Castor fi ber ), elk ( Alces alces ),
brown bear ( Ursus arctos ), wolf ( Canis lupus ), Eurasian lynx ( Lynx lynx )). Data from Maroo & Yalden (2000) .
Species
Mesolithic population
Recent population
Change
Red squirrel
Sciurus vulgaris
11,774,912
160,000
− 99%
Hazel dormouse
Muscardinus avellanarius
25,841,031
500,000
− 98%
European pine marten
Martes martes
147,474
3,650
− 98%
European badger
Meles meles
13,752
250,000
+ 1,718%
Stoat
Mustela erminea
66,033
462,000
+ 600%
Red fox
Vulpes vulpes
72,367
240,000
+ 232%