

Conservation planning in a changing world
165
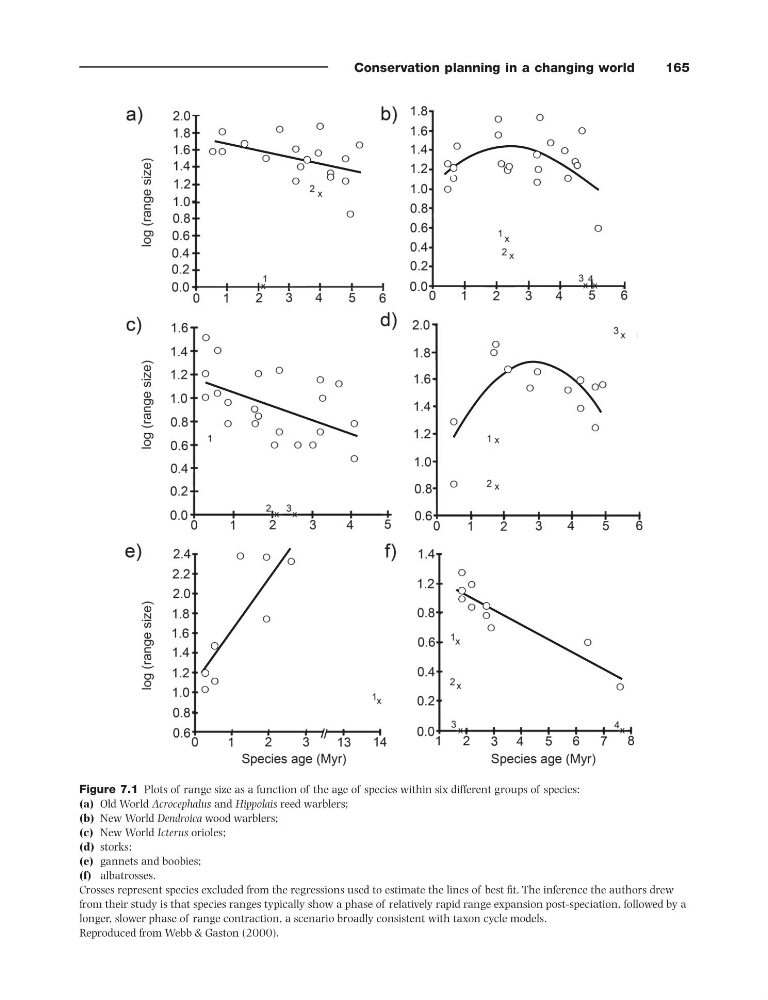
Figure 7.1 Plots of range size as a function of the age of species within six different groups of species:
(a) Old World Acrocephalus and Hippolais reed warblers;
(b) New World Dendroica wood warblers;
(c) New World Icterus orioles;
(d) storks;
(e) gannets and boobies;
(f) albatrosses.
Crosses represent species excluded from the regressions used to estimate the lines of best fi t. The inference the authors drew
from their study is that species ranges typically show a phase of relatively rapid range expansion post - speciation, followed by a
longer, slower phase of range contraction, a scenario broadly consistent with taxon cycle models.
Reproduced from Webb & Gaston (2000) .
165
Figure 7.1 Plots of range size as a function of the age of species within six different groups of species:
(a) Old World Acrocephalus and Hippolais reed warblers;
(b) New World Dendroica wood warblers;
(c) New World Icterus orioles;
(d) storks;
(e) gannets and boobies;
(f) albatrosses.
Crosses represent species excluded from the regressions used to estimate the lines of best fi t. The inference the authors drew
from their study is that species ranges typically show a phase of relatively rapid range expansion post - speciation, followed by a
longer, slower phase of range contraction, a scenario broadly consistent with taxon cycle models.
Reproduced from Webb & Gaston (2000) .