

The distribution of diversity: challenges and applications
137
1982 ). For example, it has been argued that the number
of species contained in any single area alone should not
determine its priority. More important is how any one
area complements the existing protected area network,
along with a suite of wider landscape conservation
issues (Moilanen, 2008 ). Similarly, simply relying on
the idea that ‘ a big reserve is better ’ is not useful for
making planning decisions in landscapes also required
for other human uses (e.g. agriculture, mining).
Systematic conservation planning has evolved as a
discipline to enhance the effi ciency of protected area
network design and, through creating alternative proposed networks, to allow scientists and stakeholders to
better engage with the complexity of multi - sectoral
spatial planning across landscapes and within regions.
Therefore, in general, the tools discussed in this chapter
are typically employed at fi ner scales of analysis than
the global/regional approaches discussed in Chapter 5
(but see Venter et al ., 2009 ; K.A. Wilson et al ., 2009 ).
The 1980s saw the fi rst attempts to use detailed biogeographical information and selection algorithms in
the design of protected area networks (Kirkpatrick,
1983 ). The fi eld of systematic conservation planning
has grown signifi cantly since. It has infl uenced conservation planning by some of the major environmental
organizations such as The Nature Conservancy (Groves
et al ., 2002 ) and Conservation International (Myers
et al ., 2000 ), and it has shaped policy legislation and
conservation in both terrestrial (Knight et al ., 2006 ;
Kremen et al ., 2008 ) and marine (Davis, 2005 ;
Fernandes et al ., 2005 ) environments. It has featured
in hundreds of peer - reviewed papers (Pressey et al .,
2007 ) and in recent books (e.g. Margules & Sarkar,
2007 ; Moilanen et al ., 2009 ).
In this chapter we review the key principles of systematic conservation planning and some of the current
decision support tools available to assist conservation
planners in making decisions. Decision support tools
are information systems intended to help decision -
makers compile and analyse data to help solve conservation problems. The increasing power and ease of use
of such computer - based systems in the last two decades
has opened up exciting possibilities for applications to
conservation planning. We illustrate some of these
applications from contemporary case studies, providing examples of the use of different techniques and
tools. The fi eld of conservation planning is rapidly
changing, and we discuss advances (and future challenges) in systematic conservation planning at the end
of the chapter.
habitat islands , isolated from other reserves by anthropogenically transformed habitats (sometimes named
the ‘ matrix ’ ) that are generally unsuitable for the
species of conservation concern. These early efforts
were guided by basic ecological principles, such as
that bigger protected areas are better than smaller
ones because they are likely to contain more species
(Diamond, 1975a ).
Initial approaches to systematic conservation planning were developed based on simple scoring systems,
using criteria such as species richness or number of
endemic species, to provide an indication of how new
areas might contribute to protected area networks if
they were chosen (Margules & Usher, 1981 ; Smith &
Theberge, 1986 ). The integration of these basic principles into conservation planning was a useful fi rst step,
but both conservation scientists and practitioners have
since criticized their simplicity (e.g. Simberloff & Abele,
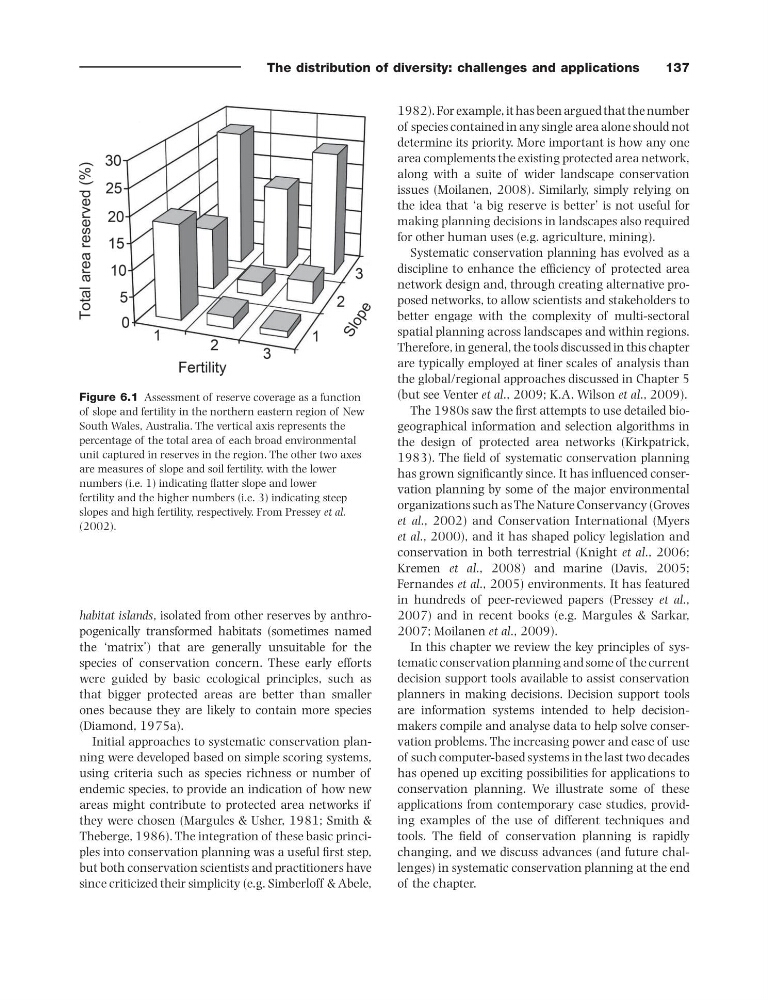
Figure 6.1 Assessment of reserve coverage as a function
of slope and fertility in the northern eastern region of New
South Wales, Australia. The vertical axis represents the
percentage of the total area of each broad environmental
unit captured in reserves in the region. The other two axes
are measures of slope and soil fertility, with the lower
numbers (i.e. 1) indicating fl atter slope and lower
fertility and the higher numbers (i.e. 3) indicating steep
slopes and high fertility, respectively. From Pressey et al.
(2002) .
137
1982 ). For example, it has been argued that the number
of species contained in any single area alone should not
determine its priority. More important is how any one
area complements the existing protected area network,
along with a suite of wider landscape conservation
issues (Moilanen, 2008 ). Similarly, simply relying on
the idea that ‘ a big reserve is better ’ is not useful for
making planning decisions in landscapes also required
for other human uses (e.g. agriculture, mining).
Systematic conservation planning has evolved as a
discipline to enhance the effi ciency of protected area
network design and, through creating alternative proposed networks, to allow scientists and stakeholders to
better engage with the complexity of multi - sectoral
spatial planning across landscapes and within regions.
Therefore, in general, the tools discussed in this chapter
are typically employed at fi ner scales of analysis than
the global/regional approaches discussed in Chapter 5
(but see Venter et al ., 2009 ; K.A. Wilson et al ., 2009 ).
The 1980s saw the fi rst attempts to use detailed biogeographical information and selection algorithms in
the design of protected area networks (Kirkpatrick,
1983 ). The fi eld of systematic conservation planning
has grown signifi cantly since. It has infl uenced conservation planning by some of the major environmental
organizations such as The Nature Conservancy (Groves
et al ., 2002 ) and Conservation International (Myers
et al ., 2000 ), and it has shaped policy legislation and
conservation in both terrestrial (Knight et al ., 2006 ;
Kremen et al ., 2008 ) and marine (Davis, 2005 ;
Fernandes et al ., 2005 ) environments. It has featured
in hundreds of peer - reviewed papers (Pressey et al .,
2007 ) and in recent books (e.g. Margules & Sarkar,
2007 ; Moilanen et al ., 2009 ).
In this chapter we review the key principles of systematic conservation planning and some of the current
decision support tools available to assist conservation
planners in making decisions. Decision support tools
are information systems intended to help decision -
makers compile and analyse data to help solve conservation problems. The increasing power and ease of use
of such computer - based systems in the last two decades
has opened up exciting possibilities for applications to
conservation planning. We illustrate some of these
applications from contemporary case studies, providing examples of the use of different techniques and
tools. The fi eld of conservation planning is rapidly
changing, and we discuss advances (and future challenges) in systematic conservation planning at the end
of the chapter.
habitat islands , isolated from other reserves by anthropogenically transformed habitats (sometimes named
the ‘ matrix ’ ) that are generally unsuitable for the
species of conservation concern. These early efforts
were guided by basic ecological principles, such as
that bigger protected areas are better than smaller
ones because they are likely to contain more species
(Diamond, 1975a ).
Initial approaches to systematic conservation planning were developed based on simple scoring systems,
using criteria such as species richness or number of
endemic species, to provide an indication of how new
areas might contribute to protected area networks if
they were chosen (Margules & Usher, 1981 ; Smith &
Theberge, 1986 ). The integration of these basic principles into conservation planning was a useful fi rst step,
but both conservation scientists and practitioners have
since criticized their simplicity (e.g. Simberloff & Abele,
Figure 6.1 Assessment of reserve coverage as a function
of slope and fertility in the northern eastern region of New
South Wales, Australia. The vertical axis represents the
percentage of the total area of each broad environmental
unit captured in reserves in the region. The other two axes
are measures of slope and soil fertility, with the lower
numbers (i.e. 1) indicating fl atter slope and lower
fertility and the higher numbers (i.e. 3) indicating steep
slopes and high fertility, respectively. From Pressey et al.
(2002) .