

The distribution of diversity: challenges and applications
125
published for the high seas: the Global Open Oceans
and Deep Seabed classifi cation (UNESCO, 2009 ).
Using the MEOW classifi cation, the current global
distribution of MPAs can be seen to be highly biased.
Approximately half (115) of the marine ecoregions
have less than 1 per cent MPA coverage, with 21 (9 per
cent) of them lacking any MPA. At the other end of the
spectrum, 42 (18 per cent) have more than 10 per cent
MPA coverage and a subset of these, 26 (11 per cent),
have more than 20 per cent coverage.
These statistics are heavily infl uenced by a few large
MPAs. For example, the Great Barrier Reef Marine Park
in Australia accounts for over 20 per cent of the global
total shelf MPA coverage. Coastal zones are better represented, with over 12 per cent of the global total area
under some form of MPA protection (Spalding et al .,
2008 ).
Despite the absence, until now, of a suitable framework to enable development of a representative system
of MPAs on a global scale, the approach has been used
successfully at regional levels. For example the representation principle underpinned priority - setting and
zoning in the Great Barrier Reef, Australia (Fernandes
et al ., 2005 ), the Gulf of California, Mexico (Sala et al .,
2002 ) and MPA network planning in the Channel
Islands National Marine Sanctuary, California (Airame
et al ., 2003 ).
Representative and distinctive marine habitats are
commonly defi ned through multidimensional habitat
classifi cation, using depth, exposure, substrate type,
dominant plant assemblages, faunal distributions and
biogeographical classifi cation scheme on global,
regional and national levels as a basis for ensuring
adequate representation of different marine ecosystems in a wide range of protected areas ’ (Hayden et al .,
1984 , p. 199). However, the complexities of the marine
and coastal environment (Tables 4.6 , 4.7 ) are such
that, even ten years later, when a review of the global
spread of MPAs was published, a full assessment of the
representativeness of its coverage could not be completed because of a lack of an agreed biogeographical
regionalization (Kelleher et al ., 1995 ).
Frustration over the lack of a global biogeographical
classifi cation similar to the terrestrial Dasmann –
Udvardy system led to regional attempts being made to
develop appropriate marine classifi cations that would
support national conservation planning initiatives
in Australia, Canada and elsewhere (e.g. Roff et al .,
2003 ). These regional classifi cations have now been
compiled, in combination with global schemes such as
Hayden et al . (1984) , Briggs ’ faunal provinces (Briggs,
1974 ) and Large Marine Ecosystems (Sherman, 1993 ),
to produce the Marine Ecoregions of the World (MEOW)
(Figure 5.10 ; Spalding et al ., 2007 ).
This composite scheme, which is designed to be compatible with regional biogeographical classifi cations, is
now being applied in global conservation planning and
assessment by WWF, TNC, and other international
NGOs, and has been adopted as a support tool for implementation of the Convention on Biological Diversity ’ s
programmes of work. The MEOW covers shelf regions
only. A similar consensus framework has recently been
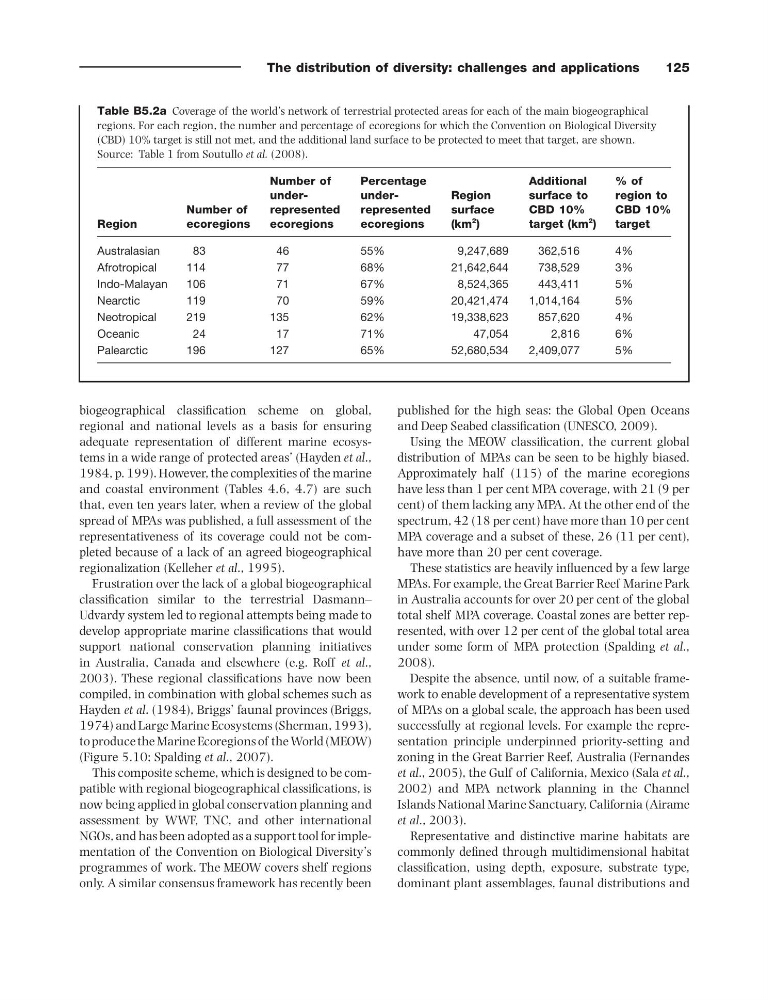
Table B5.2a Coverage of the world ’ s network of terrestrial protected areas for each of the main biogeographical
regions. For each region, the number and percentage of ecoregions for which the Convention on Biological Diversity
( CBD ) 10% target is still not met, and the additional land surface to be protected to meet that target, are shown.
Source: Table 1 from Soutullo et al. (2008) .
Region
Number of
ecoregions
Number of
under -
represented
ecoregions
Percentage
under -
represented
ecoregions
Region
surface
(km
2 )
Additional
surface to
CBD 10%
target (km
2 )
% of
region to
CBD 10%
target
Australasian
83
46
55%
9,247,689
362,516
4%
Afrotropical
114
77
68%
21,642,644
738,529
3%
Indo - Malayan
106
71
67%
8,524,365
443,411
5%
Nearctic
119
70
59%
20,421,474
1,014,164
5%
Neotropical
219
135
62%
19,338,623
857,620
4%
Oceanic
24
17
71%
47,054
2,816
6%
Palearctic
196
127
65%
52,680,534
2,409,077
5%
125
published for the high seas: the Global Open Oceans
and Deep Seabed classifi cation (UNESCO, 2009 ).
Using the MEOW classifi cation, the current global
distribution of MPAs can be seen to be highly biased.
Approximately half (115) of the marine ecoregions
have less than 1 per cent MPA coverage, with 21 (9 per
cent) of them lacking any MPA. At the other end of the
spectrum, 42 (18 per cent) have more than 10 per cent
MPA coverage and a subset of these, 26 (11 per cent),
have more than 20 per cent coverage.
These statistics are heavily infl uenced by a few large
MPAs. For example, the Great Barrier Reef Marine Park
in Australia accounts for over 20 per cent of the global
total shelf MPA coverage. Coastal zones are better represented, with over 12 per cent of the global total area
under some form of MPA protection (Spalding et al .,
2008 ).
Despite the absence, until now, of a suitable framework to enable development of a representative system
of MPAs on a global scale, the approach has been used
successfully at regional levels. For example the representation principle underpinned priority - setting and
zoning in the Great Barrier Reef, Australia (Fernandes
et al ., 2005 ), the Gulf of California, Mexico (Sala et al .,
2002 ) and MPA network planning in the Channel
Islands National Marine Sanctuary, California (Airame
et al ., 2003 ).
Representative and distinctive marine habitats are
commonly defi ned through multidimensional habitat
classifi cation, using depth, exposure, substrate type,
dominant plant assemblages, faunal distributions and
biogeographical classifi cation scheme on global,
regional and national levels as a basis for ensuring
adequate representation of different marine ecosystems in a wide range of protected areas ’ (Hayden et al .,
1984 , p. 199). However, the complexities of the marine
and coastal environment (Tables 4.6 , 4.7 ) are such
that, even ten years later, when a review of the global
spread of MPAs was published, a full assessment of the
representativeness of its coverage could not be completed because of a lack of an agreed biogeographical
regionalization (Kelleher et al ., 1995 ).
Frustration over the lack of a global biogeographical
classifi cation similar to the terrestrial Dasmann –
Udvardy system led to regional attempts being made to
develop appropriate marine classifi cations that would
support national conservation planning initiatives
in Australia, Canada and elsewhere (e.g. Roff et al .,
2003 ). These regional classifi cations have now been
compiled, in combination with global schemes such as
Hayden et al . (1984) , Briggs ’ faunal provinces (Briggs,
1974 ) and Large Marine Ecosystems (Sherman, 1993 ),
to produce the Marine Ecoregions of the World (MEOW)
(Figure 5.10 ; Spalding et al ., 2007 ).
This composite scheme, which is designed to be compatible with regional biogeographical classifi cations, is
now being applied in global conservation planning and
assessment by WWF, TNC, and other international
NGOs, and has been adopted as a support tool for implementation of the Convention on Biological Diversity ’ s
programmes of work. The MEOW covers shelf regions
only. A similar consensus framework has recently been
Table B5.2a Coverage of the world ’ s network of terrestrial protected areas for each of the main biogeographical
regions. For each region, the number and percentage of ecoregions for which the Convention on Biological Diversity
( CBD ) 10% target is still not met, and the additional land surface to be protected to meet that target, are shown.
Source: Table 1 from Soutullo et al. (2008) .
Region
Number of
ecoregions
Number of
under -
represented
ecoregions
Percentage
under -
represented
ecoregions
Region
surface
(km
2 )
Additional
surface to
CBD 10%
target (km
2 )
% of
region to
CBD 10%
target
Australasian
83
46
55%
9,247,689
362,516
4%
Afrotropical
114
77
68%
21,642,644
738,529
3%
Indo - Malayan
106
71
67%
8,524,365
443,411
5%
Nearctic
119
70
59%
20,421,474
1,014,164
5%
Neotropical
219
135
62%
19,338,623
857,620
4%
Oceanic
24
17
71%
47,054
2,816
6%
Palearctic
196
127
65%
52,680,534
2,409,077
5%