

THE DEEP-SEA FLOOR: AN OVERVIEW
7
enzyme flexibility and, therefore, catalytic rates. This
effect can be offset over evolutionary time by changes
in the amino-acid sequence of an enzyme to reduce the
number of weak interactions (e.g., hydrogen bonds) that
stabilize its three-dimensional structure (Hochachka
and Somero, 1984). The necessity for such adaptation
to low temperatures, like that to high pressure, may
constitute a barrier which a warm-water shallow-water
lineage must overcome evolutionarily to colonize the
cold deep sea.
Salinity
In shallow, coastal waters, salinity can affect benthic
species. For example, in estuaries, the organisms must
be adapted physiologically to live in water that changes
salinity with the tides. In most of the deep sea, on the
other hand, the salinity of the bottom water is fully
marine (c. 35‰). Exceptions include the Mediterranean
and Red Sea (>39‰) and hypersaline basins such as
the Orca Basin in the Gulf of Mexico (c. 300‰: Shokes
et al., 1976). At most locations in the deep sea, salinity
varies little with time, and that variation appears to be
irrelevant to the ecology of deep-sea organisms.
Oxygen
Oxygen enters the ocean by exchange with the
atmosphere and as a by-product of photosynthesis by
marine plants in the euphotic zone. The dissolved
gas is carried to the deep-sea floor by the descent of
surface waters. The water overlying most of the deepsea floor is saturated with oxygen or nearly so (5–
6 ml °
−1 ), and the variation in space and time of oxygen
concentration on the scale of an individual organism
is small in absolute terms and does not constitute an
environmental challenge for organisms living in the
near-bottom water or on the seabed.
Two major conditions reduce oxygen concentration
to levels that are problematic for organisms. First,
organic material (e.g., fecal pellets) that falls from
the euphotic zone is decomposed by aerobic bacteria and is consumed by zooplankton as it sinks.
The decomposition and animal respiration reduce the
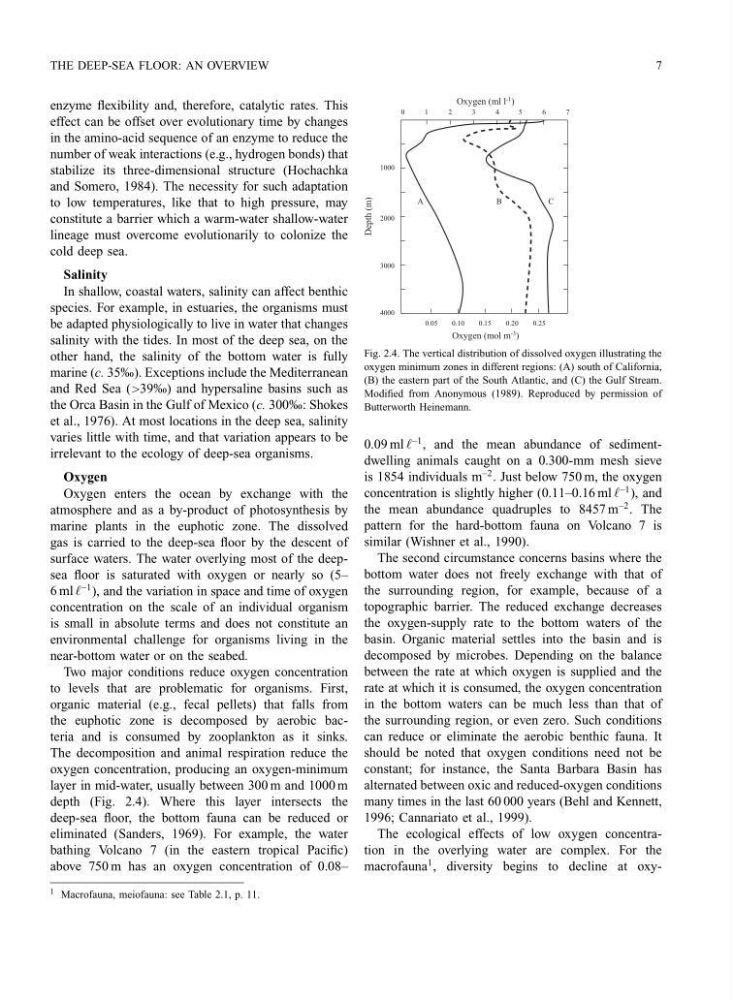
oxygen concentration, producing an oxygen-minimum
layer in mid-water, usually between 300 m and 1000 m
depth (Fig. 2.4). Where this layer intersects the
deep-sea floor, the bottom fauna can be reduced or
eliminated (Sanders, 1969). For example, the water
bathing Volcano 7 (in the eastern tropical Pacific)
above 750 m has an oxygen concentration of 0.08–
1000
2000
3000
4000
0.25
0.20
0.15
0.10
0.05
7
6
5
4
3
2
1
0
A
B
C
Oxygen (ml l )
-1
Oxygen (mol m )
-3
Depth (m)
Fig. 2.4. The vertical distribution of dissolved oxygen illustrating the
oxygen minimum zones in different regions: (A) south of California,
(B) the eastern part of the South Atlantic, and (C) the Gulf Stream.
Modified from Anonymous (1989). Reproduced by permission of
Butterworth Heinemann.
0.09 ml °
−1 , and the mean abundance of sedimentdwelling animals caught on a 0.300-mm mesh sieve
is 1854 individuals m
−2 . Just below 750 m, the oxygen
concentration is slightly higher (0.11–0.16 ml °
−1 ), and
the mean abundance quadruples to 8457 m
−2 . The
pattern for the hard-bottom fauna on Volcano 7 is
similar (Wishner et al., 1990).
The second circumstance concerns basins where the
bottom water does not freely exchange with that of
the surrounding region, for example, because of a
topographic barrier. The reduced exchange decreases
the oxygen-supply rate to the bottom waters of the
basin. Organic material settles into the basin and is
decomposed by microbes. Depending on the balance
between the rate at which oxygen is supplied and the
rate at which it is consumed, the oxygen concentration
in the bottom waters can be much less than that of
the surrounding region, or even zero. Such conditions
can reduce or eliminate the aerobic benthic fauna. It
should be noted that oxygen conditions need not be
constant; for instance, the Santa Barbara Basin has
alternated between oxic and reduced-oxygen conditions
many times in the last 60 000 years (Behl and Kennett,
1996; Cannariato et al., 1999).
The ecological effects of low oxygen concentration in the overlying water are complex. For the
macrofauna
1 , diversity begins to decline at oxy1 Macrofauna, meiofauna: see Table 2.1, p. 11.
7
enzyme flexibility and, therefore, catalytic rates. This
effect can be offset over evolutionary time by changes
in the amino-acid sequence of an enzyme to reduce the
number of weak interactions (e.g., hydrogen bonds) that
stabilize its three-dimensional structure (Hochachka
and Somero, 1984). The necessity for such adaptation
to low temperatures, like that to high pressure, may
constitute a barrier which a warm-water shallow-water
lineage must overcome evolutionarily to colonize the
cold deep sea.
Salinity
In shallow, coastal waters, salinity can affect benthic
species. For example, in estuaries, the organisms must
be adapted physiologically to live in water that changes
salinity with the tides. In most of the deep sea, on the
other hand, the salinity of the bottom water is fully
marine (c. 35‰). Exceptions include the Mediterranean
and Red Sea (>39‰) and hypersaline basins such as
the Orca Basin in the Gulf of Mexico (c. 300‰: Shokes
et al., 1976). At most locations in the deep sea, salinity
varies little with time, and that variation appears to be
irrelevant to the ecology of deep-sea organisms.
Oxygen
Oxygen enters the ocean by exchange with the
atmosphere and as a by-product of photosynthesis by
marine plants in the euphotic zone. The dissolved
gas is carried to the deep-sea floor by the descent of
surface waters. The water overlying most of the deepsea floor is saturated with oxygen or nearly so (5–
6 ml °
−1 ), and the variation in space and time of oxygen
concentration on the scale of an individual organism
is small in absolute terms and does not constitute an
environmental challenge for organisms living in the
near-bottom water or on the seabed.
Two major conditions reduce oxygen concentration
to levels that are problematic for organisms. First,
organic material (e.g., fecal pellets) that falls from
the euphotic zone is decomposed by aerobic bacteria and is consumed by zooplankton as it sinks.
The decomposition and animal respiration reduce the
oxygen concentration, producing an oxygen-minimum
layer in mid-water, usually between 300 m and 1000 m
depth (Fig. 2.4). Where this layer intersects the
deep-sea floor, the bottom fauna can be reduced or
eliminated (Sanders, 1969). For example, the water
bathing Volcano 7 (in the eastern tropical Pacific)
above 750 m has an oxygen concentration of 0.08–
1000
2000
3000
4000
0.25
0.20
0.15
0.10
0.05
7
6
5
4
3
2
1
0
A
B
C
Oxygen (ml l )
-1
Oxygen (mol m )
-3
Depth (m)
Fig. 2.4. The vertical distribution of dissolved oxygen illustrating the
oxygen minimum zones in different regions: (A) south of California,
(B) the eastern part of the South Atlantic, and (C) the Gulf Stream.
Modified from Anonymous (1989). Reproduced by permission of
Butterworth Heinemann.
0.09 ml °
−1 , and the mean abundance of sedimentdwelling animals caught on a 0.300-mm mesh sieve
is 1854 individuals m
−2 . Just below 750 m, the oxygen
concentration is slightly higher (0.11–0.16 ml °
−1 ), and
the mean abundance quadruples to 8457 m
−2 . The
pattern for the hard-bottom fauna on Volcano 7 is
similar (Wishner et al., 1990).
The second circumstance concerns basins where the
bottom water does not freely exchange with that of
the surrounding region, for example, because of a
topographic barrier. The reduced exchange decreases
the oxygen-supply rate to the bottom waters of the
basin. Organic material settles into the basin and is
decomposed by microbes. Depending on the balance
between the rate at which oxygen is supplied and the
rate at which it is consumed, the oxygen concentration
in the bottom waters can be much less than that of
the surrounding region, or even zero. Such conditions
can reduce or eliminate the aerobic benthic fauna. It
should be noted that oxygen conditions need not be
constant; for instance, the Santa Barbara Basin has
alternated between oxic and reduced-oxygen conditions
many times in the last 60 000 years (Behl and Kennett,
1996; Cannariato et al., 1999).
The ecological effects of low oxygen concentration in the overlying water are complex. For the
macrofauna
1 , diversity begins to decline at oxy1 Macrofauna, meiofauna: see Table 2.1, p. 11.