

Climate change in arid and tropical humid regions
671
O_
o4
o o
v
l_
.1--,
G)
E
(1)
.i-,
o
0g LOAge (Ma)
0
0
0
0
1
1
1
1
Palaeocene 1
Eocene
I
Oligocene
O
....
I
Miocene
0
1
-7
_.L
+
+
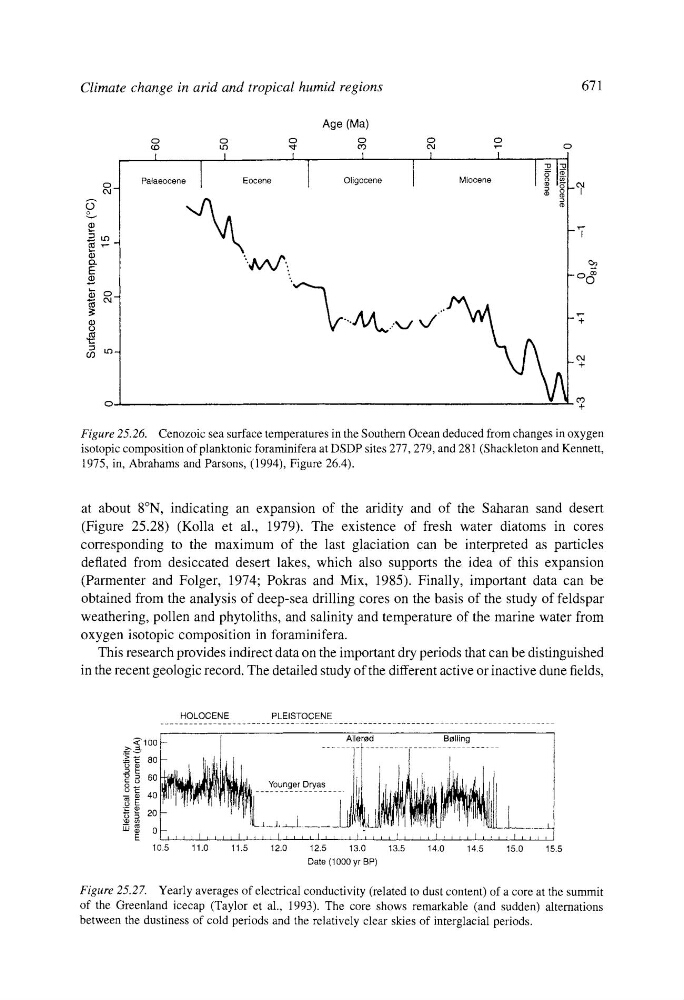
Figure 25.26. Cenozoic sea surface temperatures in the Southern Ocean deduced from changes in oxygen
isotopic composition of planktonic foraminifera at DSDP sites 277,279, and 281 (Shackleton and Kennett,
1975, in, Abrahams and Parsons, (1994), Figure 26.4).
at about 8~ indicating an expansion of the aridity and of the Saharan sand desert
(Figure 25.28) (Kolla et al., 1979). The existence of fresh water diatoms in cores
corresponding to the maximum of the last glaciation can be interpreted as particles
deflated from desiccated desert lakes, which also supports the idea of this expansion
(Parmenter and Folger, 1974; Pokras and Mix, 1985). Finally, important data can be
obtained from the analysis of deep-sea drilling cores on the basis of the study of feldspar
weathering, pollen and phytoliths, and salinity and temperature of the marine water from
oxygen isotopic composition in foraminifera.
This research provides indirect data on the important dry periods that can be distinguished
in the recent geologic record. The detailed study of the different active or inactive dune fields,
HOLOCENE
PLEISTOCENE
..................................................
~'100
._
._>
~ 60
9 ~
40
n~ 0
E
10.5
_
Aller~d
B~lling
~,~~~l
Younger Dryas
.....
__J_
11.0
11.5
12.0
12.5
13.0
13.5
14.0
14.5
15.0
15.5
Date (1000 yr BP)
Figure 25.27. Yearly averages of electrical conductivity (related to dust content) of a core at the summit
of the Greenland icecap (Taylor et al., 1993). The core shows remarkable (and sudden) alternations
between the dustiness of cold periods and the relatively clear skies of interglacial periods.