

632
Climatic Geomorphology
Figure 24.13. Bertrand Glacier which supplies sediments to the Argentine Lake, Patagonia, Argentina.
Photo: C. Sancho.
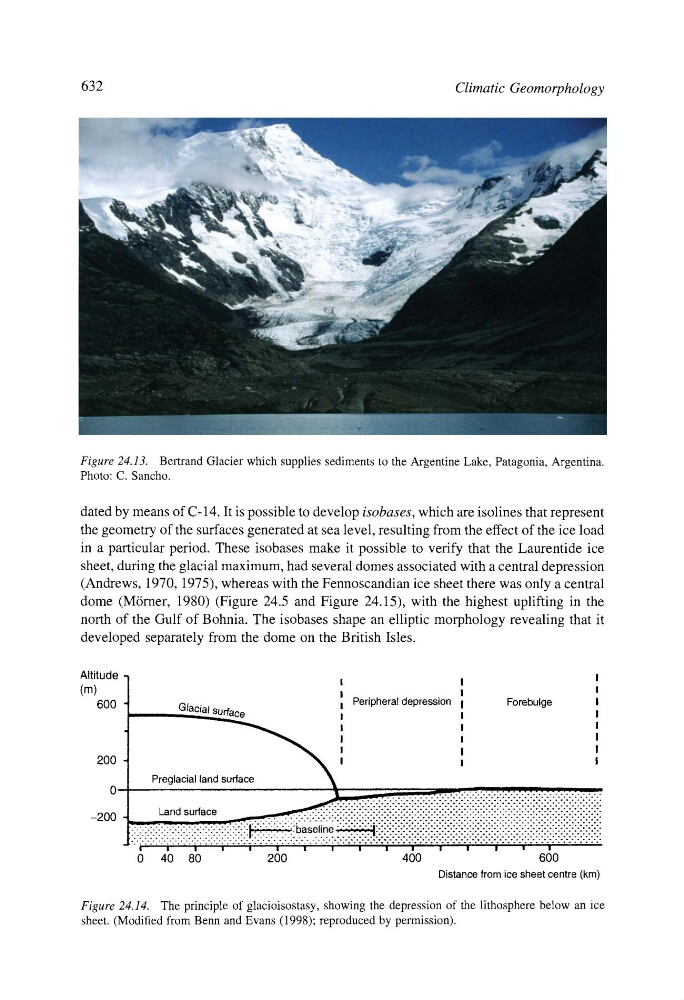
dated by means of C- 14. It is possible to develop isobases, which are isolines that represent
the geometry of the surfaces generated at sea level, resulting from the effect of the ice load
in a particular period. These isobases make it possible to verify that the Laurentide ice
sheet, during the glacial maximum, had several domes associated with a central depression
(Andrews, 1970, 1975), whereas with the Fennoscandian ice sheet there was only a central
dome (M6rner, 1980) (Figure 24.5 and Figure 24.15), with the highest uplifting in the
north of the Gulf of Bohnia. The isobases shape an elliptic morphology revealing that it
developed separately from the dome on the British Isles.
Altitude
(m)
600
200
0--200 -
i
I
I
I
I
I
I Peripheral depression I
Forebulge
I
Glacial surface
!
I
I
~
I
I
I
I
I
I
I
I
I
I
I
I
......
...................:.-.:.:.:.:.:.:.:.:.:.:.:.:.:..:.:-:-:.:--:-:-:-:--:-:-:
Land surface
......:.::•:i:i:i:!:i:!:i:i:i:i:i•i:i:i:i•i•i•i•i•i:i:!:i•i•i:!:i:i•!•i•!:i:i:i:i:i:i:i:i:i:i:i:i:i:i:i:i:i:i:
F.--:-.-.-.:::.-;-.-.-.-.-.:.-.::-.-.-.-:-.-'-:-:-:-:-:-:-:-:' " " : " : •: •: •: •: •: •: i : •: •••: •: •••: •••••••••••••••••. ••••••••••••••••••••••••••••••: •: •: •: •: . : •: •: •: •: . :
::::::::::::::::::::::::::::::::::::::::::::::ba:e::ne
::::::::::::::::::::::::::::::::::::::::::::::::::::::::::::::::::::::::::•:•:::•:•:::::•::::
"'" F ~" " i ..... i ............. ~ ........ ~ ..... ~ ..... "i ~' " """~ .... "'" ~ .... i .... .'" ~'~/" .... , ..... i ~'" ~i ~ ~' ' ' " ' ~,~ ~ .......
0 40 80
200
400
600
Distance from ice sheet centre (km)
Figure 24.14. The principle of glacioisostasy, showing the depression of the lithosphere below an ice
sheet. (Modified from Benn and Evans (1998); reproduced by permission).