

22
Climatic Geomorphology
reactions by the higher temperatures. On the contrary, in the tundra and desert zones
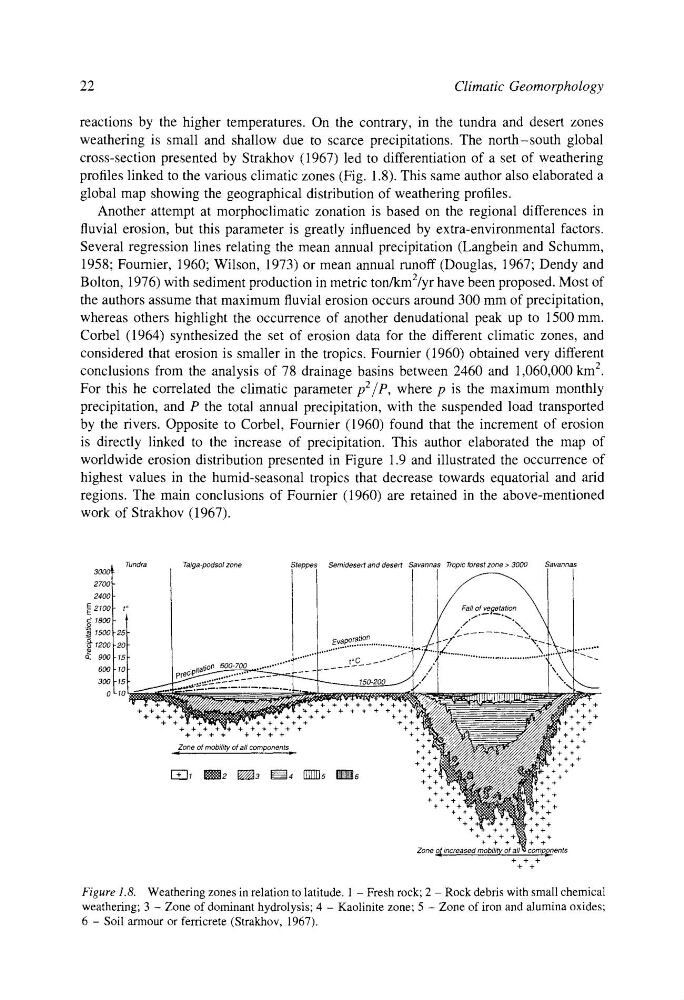
weathering is small and shallow due to scarce precipitations. The north-south global
cross-section presented by Strakhov (1967) led to differentiation of a set of weathering
profiles linked to the various climatic zones (Fig. 1.8). This same author also elaborated a
global map showing the geographical distribution of weathering profiles.
Another attempt at morphoclimatic zonation is based on the regional differences in
fluvial erosion, but this parameter is greatly influenced by extra-environmental factors.
Several regression lines relating the mean annual precipitation (Langbein and Schumm,
1958; Fournier, 1960; Wilson, 1973) or mean annual runoff (Douglas, 1967; Dendy and
Bolton, 1976) with sediment production in metric ton/kmZ/yr have been proposed. Most of
the authors assume that maximum fluvial erosion occurs around 300 mm of precipitation,
whereas others highlight the occurrence of another denudational peak up to 1500 mm.
Corbel (1964) synthesized the set of erosion data for the different climatic zones, and
considered that erosion is smaller in the tropics. Fournier (1960) obtained very different
conclusions from the analysis of 78 drainage basins between 2460 and 1,060,000 km 2.
For this he correlated the climatic parameter p2/p, where p is the maximum monthly
precipitation, and P the total annual precipitation, with the suspended load transported
by the rivers. Opposite to Corbel, Fournier (1960) found that the increment of erosion
is directly linked to the increase of precipitation. This author elaborated the map of
worldwide erosion distribution presented in Figure 1.9 and illustrated the occurrence of
highest values in the humid-seasonal tropics that decrease towards equatorial and arid
regions. The main conclusions of Fournier (1960) are retained in the above-mentioned
work of Strakhov (1967).
300~. Tundra
Taiga-podsol zone
Steppes Semidesert and desert Savannas Tropic forest zone > 3000
Savannas
27001
2400 I
E2100 I- t ~
~ 15001-25
oration
"~ 12002
Eva9
- 0
...............................
~
~
.....
~" 600900 F
.... ion 600-700 .............
... t~C .
.
.
.
.
,oof::
o
+++++
Figure 1.8. Weathering zones in relation to latitude. 1 - Fresh rock; 2 - Rock debris with small chemical
weathering; 3 - Zone of dominant hydrolysis; 4 - Kaolinite zone; 5 - Zone of iron and alumina oxides;
6 - Soil armour or ferricrete (Strakhov, 1967).
Climatic Geomorphology
reactions by the higher temperatures. On the contrary, in the tundra and desert zones
weathering is small and shallow due to scarce precipitations. The north-south global
cross-section presented by Strakhov (1967) led to differentiation of a set of weathering
profiles linked to the various climatic zones (Fig. 1.8). This same author also elaborated a
global map showing the geographical distribution of weathering profiles.
Another attempt at morphoclimatic zonation is based on the regional differences in
fluvial erosion, but this parameter is greatly influenced by extra-environmental factors.
Several regression lines relating the mean annual precipitation (Langbein and Schumm,
1958; Fournier, 1960; Wilson, 1973) or mean annual runoff (Douglas, 1967; Dendy and
Bolton, 1976) with sediment production in metric ton/kmZ/yr have been proposed. Most of
the authors assume that maximum fluvial erosion occurs around 300 mm of precipitation,
whereas others highlight the occurrence of another denudational peak up to 1500 mm.
Corbel (1964) synthesized the set of erosion data for the different climatic zones, and
considered that erosion is smaller in the tropics. Fournier (1960) obtained very different
conclusions from the analysis of 78 drainage basins between 2460 and 1,060,000 km 2.
For this he correlated the climatic parameter p2/p, where p is the maximum monthly
precipitation, and P the total annual precipitation, with the suspended load transported
by the rivers. Opposite to Corbel, Fournier (1960) found that the increment of erosion
is directly linked to the increase of precipitation. This author elaborated the map of
worldwide erosion distribution presented in Figure 1.9 and illustrated the occurrence of
highest values in the humid-seasonal tropics that decrease towards equatorial and arid
regions. The main conclusions of Fournier (1960) are retained in the above-mentioned
work of Strakhov (1967).
300~. Tundra
Taiga-podsol zone
Steppes Semidesert and desert Savannas Tropic forest zone > 3000
Savannas
27001
2400 I
E2100 I- t ~
~ 15001-25
oration
"~ 12002
Eva9
- 0
...............................
~
~
.....
~" 600900 F
.... ion 600-700 .............
... t~C .
.
.
.
.
,oof::
o
+++++
Figure 1.8. Weathering zones in relation to latitude. 1 - Fresh rock; 2 - Rock debris with small chemical
weathering; 3 - Zone of dominant hydrolysis; 4 - Kaolinite zone; 5 - Zone of iron and alumina oxides;
6 - Soil armour or ferricrete (Strakhov, 1967).