

Biochemical Systematics and Ecology 96 (2021) 104262
9
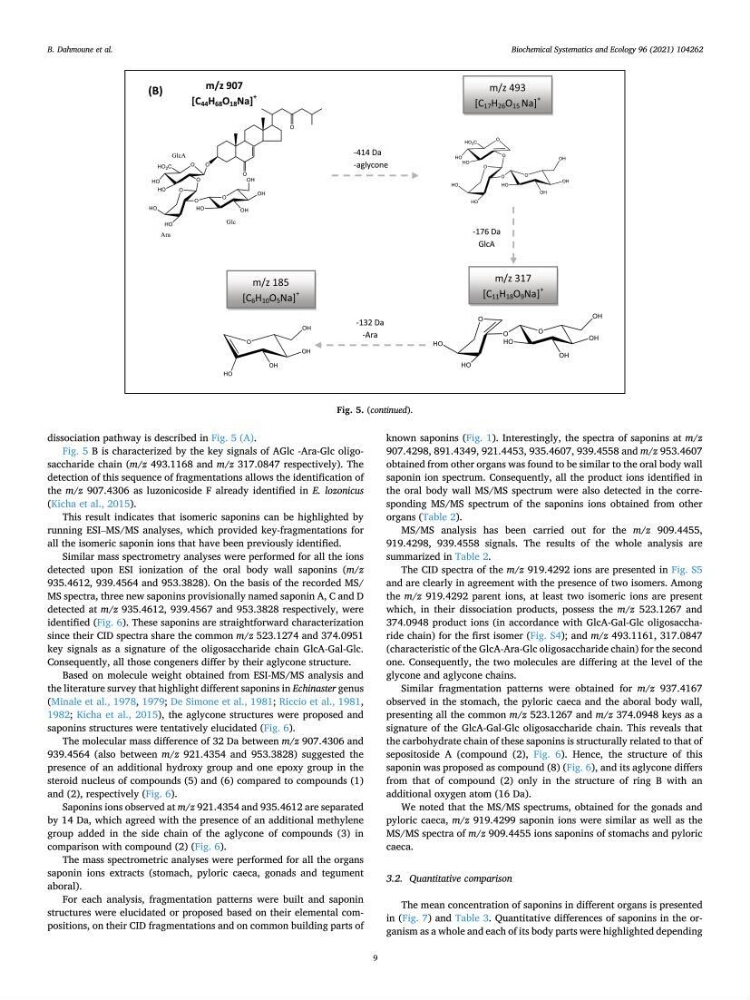
dissociation pathway is described in Fig. 5 (A).
Fig. 5 B is characterized by the key signals of AGlc -Ara-Glc oligosaccharide chain (m/z 493.1168 and m/z 317.0847 respectively). The
detection of this sequence of fragmentations allows the identification of
the m/z 907.4306 as luzonicoside F already identified in E. lozonicus
(Kicha et al., 2015).
This result indicates that isomeric saponins can be highlighted by
running ESI–MS/MS analyses, which provided key-fragmentations for
all the isomeric saponin ions that have been previously identified.
Similar mass spectrometry analyses were performed for all the ions
detected upon ESI ionization of the oral body wall saponins (m/z
935.4612, 939.4564 and 953.3828). On the basis of the recorded MS/
MS spectra, three new saponins provisionally named saponin A, C and D
detected at m/z 935.4612, 939.4567 and 953.3828 respectively, were
identified (Fig. 6). These saponins are straightforward characterization
since their CID spectra share the common m/z 523.1274 and 374.0951
key signals as a signature of the oligosaccharide chain GlcA-Gal-Glc.
Consequently, all those congeners differ by their aglycone structure.
Based on molecule weight obtained from ESI-MS/MS analysis and
the literature survey that highlight different saponins in Echinaster genus
(Minale et al., 1978, 1979; De Simone et al., 1981; Riccio et al., 1981,
1982; Kicha et al., 2015), the aglycone structures were proposed and
saponins structures were tentatively elucidated (Fig. 6).
The molecular mass difference of 32 Da between m/z 907.4306 and
939.4564 (also between m/z 921.4354 and 953.3828) suggested the
presence of an additional hydroxy group and one epoxy group in the
steroid nucleus of compounds (5) and (6) compared to compounds (1)
and (2), respectively (Fig. 6).
Saponins ions observed at m/z 921.4354 and 935.4612 are separated
by 14 Da, which agreed with the presence of an additional methylene
group added in the side chain of the aglycone of compounds (3) in
comparison with compound (2) (Fig. 6).
The mass spectrometric analyses were performed for all the organs
saponin ions extracts (stomach, pyloric caeca, gonads and tegument
aboral).
For each analysis, fragmentation patterns were built and saponin
structures were elucidated or proposed based on their elemental compositions, on their CID fragmentations and on common building parts of
known saponins (Fig. 1). Interestingly, the spectra of saponins at m/z
907.4298, 891.4349, 921.4453, 935.4607, 939.4558 and m/z 953.4607
obtained from other organs was found to be similar to the oral body wall
saponin ion spectrum. Consequently, all the product ions identified in
the oral body wall MS/MS spectrum were also detected in the corresponding MS/MS spectrum of the saponins ions obtained from other
organs (Table 2).
MS/MS analysis has been carried out for the m/z 909.4455,
919.4298, 939.4558 signals. The results of the whole analysis are
summarized in Table 2.
The CID spectra of the m/z 919.4292 ions are presented in Fig. S5
and are clearly in agreement with the presence of two isomers. Among
the m/z 919.4292 parent ions, at least two isomeric ions are present
which, in their dissociation products, possess the m/z 523.1267 and
374.0948 product ions (in accordance with GlcA-Gal-Glc oligosaccharide chain) for the first isomer (Fig. S4); and m/z 493.1161, 317.0847
(characteristic of the GlcA-Ara-Glc oligosaccharide chain) for the second
one. Consequently, the two molecules are differing at the level of the
glycone and aglycone chains.
Similar fragmentation patterns were obtained for m/z 937.4167
observed in the stomach, the pyloric caeca and the aboral body wall,
presenting all the common m/z 523.1267 and m/z 374.0948 keys as a
signature of the GlcA-Gal-Glc oligosaccharide chain. This reveals that
the carbohydrate chain of these saponins is structurally related to that of
sepositoside A (compound (2), Fig. 6). Hence, the structure of this
saponin was proposed as compound (8) (Fig. 6), and its aglycone differs
from that of compound (2) only in the structure of ring B with an
additional oxygen atom (16 Da).
We noted that the MS/MS spectrums, obtained for the gonads and
pyloric caeca, m/z 919.4299 saponin ions were similar as well as the
MS/MS spectra of m/z 909.4455 ions saponins of stomachs and pyloric
caeca.
3.2. Quantitative comparison
The mean concentration of saponins in different organs is presented
in (Fig. 7) and Table 3. Quantitative differences of saponins in the organism as a whole and each of its body parts were highlighted depending
Fig. 5. (continued).
B. Dahmoune et al.
9
dissociation pathway is described in Fig. 5 (A).
Fig. 5 B is characterized by the key signals of AGlc -Ara-Glc oligosaccharide chain (m/z 493.1168 and m/z 317.0847 respectively). The
detection of this sequence of fragmentations allows the identification of
the m/z 907.4306 as luzonicoside F already identified in E. lozonicus
(Kicha et al., 2015).
This result indicates that isomeric saponins can be highlighted by
running ESI–MS/MS analyses, which provided key-fragmentations for
all the isomeric saponin ions that have been previously identified.
Similar mass spectrometry analyses were performed for all the ions
detected upon ESI ionization of the oral body wall saponins (m/z
935.4612, 939.4564 and 953.3828). On the basis of the recorded MS/
MS spectra, three new saponins provisionally named saponin A, C and D
detected at m/z 935.4612, 939.4567 and 953.3828 respectively, were
identified (Fig. 6). These saponins are straightforward characterization
since their CID spectra share the common m/z 523.1274 and 374.0951
key signals as a signature of the oligosaccharide chain GlcA-Gal-Glc.
Consequently, all those congeners differ by their aglycone structure.
Based on molecule weight obtained from ESI-MS/MS analysis and
the literature survey that highlight different saponins in Echinaster genus
(Minale et al., 1978, 1979; De Simone et al., 1981; Riccio et al., 1981,
1982; Kicha et al., 2015), the aglycone structures were proposed and
saponins structures were tentatively elucidated (Fig. 6).
The molecular mass difference of 32 Da between m/z 907.4306 and
939.4564 (also between m/z 921.4354 and 953.3828) suggested the
presence of an additional hydroxy group and one epoxy group in the
steroid nucleus of compounds (5) and (6) compared to compounds (1)
and (2), respectively (Fig. 6).
Saponins ions observed at m/z 921.4354 and 935.4612 are separated
by 14 Da, which agreed with the presence of an additional methylene
group added in the side chain of the aglycone of compounds (3) in
comparison with compound (2) (Fig. 6).
The mass spectrometric analyses were performed for all the organs
saponin ions extracts (stomach, pyloric caeca, gonads and tegument
aboral).
For each analysis, fragmentation patterns were built and saponin
structures were elucidated or proposed based on their elemental compositions, on their CID fragmentations and on common building parts of
known saponins (Fig. 1). Interestingly, the spectra of saponins at m/z
907.4298, 891.4349, 921.4453, 935.4607, 939.4558 and m/z 953.4607
obtained from other organs was found to be similar to the oral body wall
saponin ion spectrum. Consequently, all the product ions identified in
the oral body wall MS/MS spectrum were also detected in the corresponding MS/MS spectrum of the saponins ions obtained from other
organs (Table 2).
MS/MS analysis has been carried out for the m/z 909.4455,
919.4298, 939.4558 signals. The results of the whole analysis are
summarized in Table 2.
The CID spectra of the m/z 919.4292 ions are presented in Fig. S5
and are clearly in agreement with the presence of two isomers. Among
the m/z 919.4292 parent ions, at least two isomeric ions are present
which, in their dissociation products, possess the m/z 523.1267 and
374.0948 product ions (in accordance with GlcA-Gal-Glc oligosaccharide chain) for the first isomer (Fig. S4); and m/z 493.1161, 317.0847
(characteristic of the GlcA-Ara-Glc oligosaccharide chain) for the second
one. Consequently, the two molecules are differing at the level of the
glycone and aglycone chains.
Similar fragmentation patterns were obtained for m/z 937.4167
observed in the stomach, the pyloric caeca and the aboral body wall,
presenting all the common m/z 523.1267 and m/z 374.0948 keys as a
signature of the GlcA-Gal-Glc oligosaccharide chain. This reveals that
the carbohydrate chain of these saponins is structurally related to that of
sepositoside A (compound (2), Fig. 6). Hence, the structure of this
saponin was proposed as compound (8) (Fig. 6), and its aglycone differs
from that of compound (2) only in the structure of ring B with an
additional oxygen atom (16 Da).
We noted that the MS/MS spectrums, obtained for the gonads and
pyloric caeca, m/z 919.4299 saponin ions were similar as well as the
MS/MS spectra of m/z 909.4455 ions saponins of stomachs and pyloric
caeca.
3.2. Quantitative comparison
The mean concentration of saponins in different organs is presented
in (Fig. 7) and Table 3. Quantitative differences of saponins in the organism as a whole and each of its body parts were highlighted depending
Fig. 5. (continued).
B. Dahmoune et al.