

Aiken
38
complexity. Spectra obtained for complex mixtures of molecules, such as DOM, are generally considered to represent the average of individual compounds that comprise the mixture (Miller, 1994), although recent studies have shown that intramolecular interactions
also strongly influence DOM UV-visible spectra, especially at longer wavelengths (Del
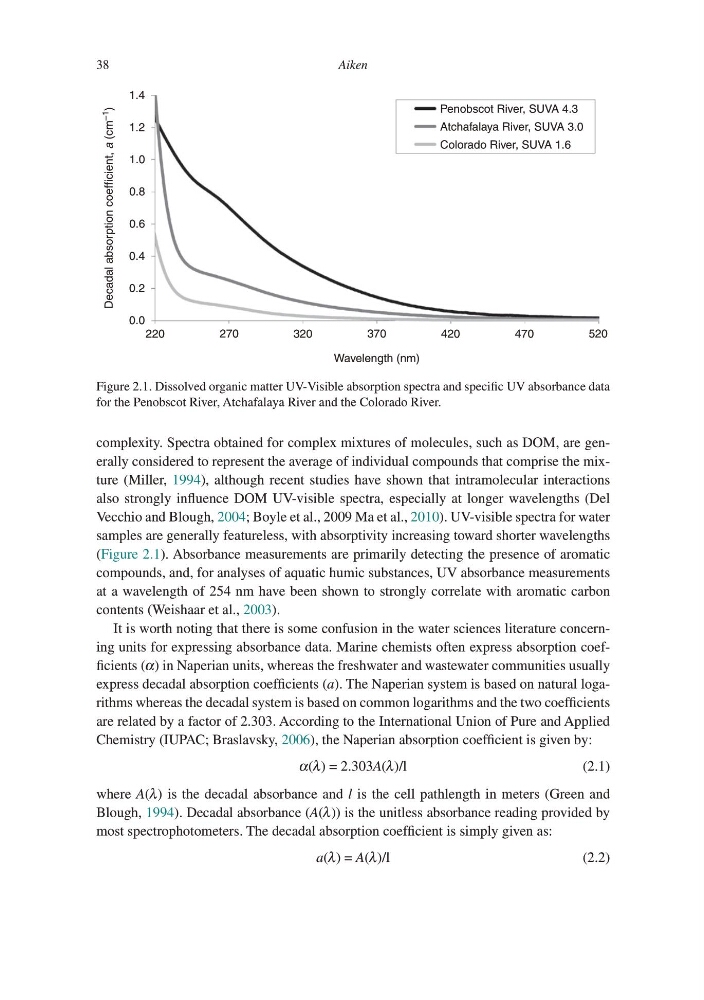
Vecchio and Blough, 2004; Boyle et al., 2009 Ma et al., 2010). UV-visible spectra for water
samples are generally featureless, with absorptivity increasing toward shorter wavelengths
(Figure 2.1). Absorbance measurements are primarily detecting the presence of aromatic
compounds, and, for analyses of aquatic humic substances, UV absorbance measurements
at a wavelength of 254 nm have been shown to strongly correlate with aromatic carbon
contents (Weishaar et al., 2003).
It is worth noting that there is some confusion in the water sciences literature concerning units for expressing absorbance data. Marine chemists often express absorption coefficients (α) in Naperian units, whereas the freshwater and wastewater communities usually
express decadal absorption coefficients (a). The Naperian system is based on natural logarithms whereas the decadal system is based on common logarithms and the two coefficients
are related by a factor of 2.303. According to the International Union of Pure and Applied
Chemistry (IUPAC; Braslavsky, 2006), the Naperian absorption coefficient is given by:
α(λ) = 2.303A(λ)/l
(2.1)
where A(λ) is the decadal absorbance and l is the cell pathlength in meters (Green and
Blough, 1994). Decadal absorbance (A(λ)) is the unitless absorbance reading provided by
most spectrophotometers. The decadal absorption coefficient is simply given as:
a(λ) = A(λ)/l
(2.2)
1.4
1.2
0.4
Decadal absorption coefficient, a (cm
–1
)
0.2
0.0
220
320
420
470
Penobscot River, SUVA 4.3
Atchafalaya River, SUVA 3.0
Colorado River, SUVA 1.6
520
370
Wavelength (nm)
270
0.6
0.8
1.0
Figure 2.1. Dissolved organic matter UV-Visible absorption spectra and specific UV absorbance data
for the Penobscot River, Atchafalaya River and the Colorado River.
38
complexity. Spectra obtained for complex mixtures of molecules, such as DOM, are generally considered to represent the average of individual compounds that comprise the mixture (Miller, 1994), although recent studies have shown that intramolecular interactions
also strongly influence DOM UV-visible spectra, especially at longer wavelengths (Del
Vecchio and Blough, 2004; Boyle et al., 2009 Ma et al., 2010). UV-visible spectra for water
samples are generally featureless, with absorptivity increasing toward shorter wavelengths
(Figure 2.1). Absorbance measurements are primarily detecting the presence of aromatic
compounds, and, for analyses of aquatic humic substances, UV absorbance measurements
at a wavelength of 254 nm have been shown to strongly correlate with aromatic carbon
contents (Weishaar et al., 2003).
It is worth noting that there is some confusion in the water sciences literature concerning units for expressing absorbance data. Marine chemists often express absorption coefficients (α) in Naperian units, whereas the freshwater and wastewater communities usually
express decadal absorption coefficients (a). The Naperian system is based on natural logarithms whereas the decadal system is based on common logarithms and the two coefficients
are related by a factor of 2.303. According to the International Union of Pure and Applied
Chemistry (IUPAC; Braslavsky, 2006), the Naperian absorption coefficient is given by:
α(λ) = 2.303A(λ)/l
(2.1)
where A(λ) is the decadal absorbance and l is the cell pathlength in meters (Green and
Blough, 1994). Decadal absorbance (A(λ)) is the unitless absorbance reading provided by
most spectrophotometers. The decadal absorption coefficient is simply given as:
a(λ) = A(λ)/l
(2.2)
1.4
1.2
0.4
Decadal absorption coefficient, a (cm
–1
)
0.2
0.0
220
320
420
470
Penobscot River, SUVA 4.3
Atchafalaya River, SUVA 3.0
Colorado River, SUVA 1.6
520
370
Wavelength (nm)
270
0.6
0.8
1.0
Figure 2.1. Dissolved organic matter UV-Visible absorption spectra and specific UV absorbance data
for the Penobscot River, Atchafalaya River and the Colorado River.