

Murphy, Bro, and Stedmon
366
Predictive chemometric techniques, particularly PLS, have frequently been applied
to fluorescence data sets in biomedical and industrial applications. Published examples
involving DOM data sets are, in contrast, relatively few. Persson and Wedborg (2001)
used PLS to predict the pedogenic versus marine origin of fluorescent DOM in the Baltic
Sea. Murphy et al. (2009) attempted to predict the origin of marine fluorescence samples
(in terms of distance from land) using PLS. Several authors have used fluorescence and
PLS or PCR to monitor water quality in wastewater supply systems and in bioreactors
(Vasel and Praet, 2002; Marhaba et al., 2003; Morel et al., 2004; Wolf et al., 2007). PLS
has also been used to predict a range of chemical and microbiological variables from
fluorescence measurements in soils and forest floor leachates (Simonsson et al., 2005;
Rinnan and Rinnan, 2007).
10.10 Classification
Often, it is desired to assign samples to preestablished categories or classes. Such classes
may describe, for example, differences in the origins of samples in a data set, whether
0
100
200
300
400
0
100
200
300
400
0
100
200
300
400
0
100
200
300
400
200
400
600
800
1000
1200
DOC measured (circles), predicted (squares)
500
1000
1500
2000
0
500
1000
1500
2000
Days after 29−Aug−2005
150
200
250
300
350
400
(a)
(c)
(b)
(d)
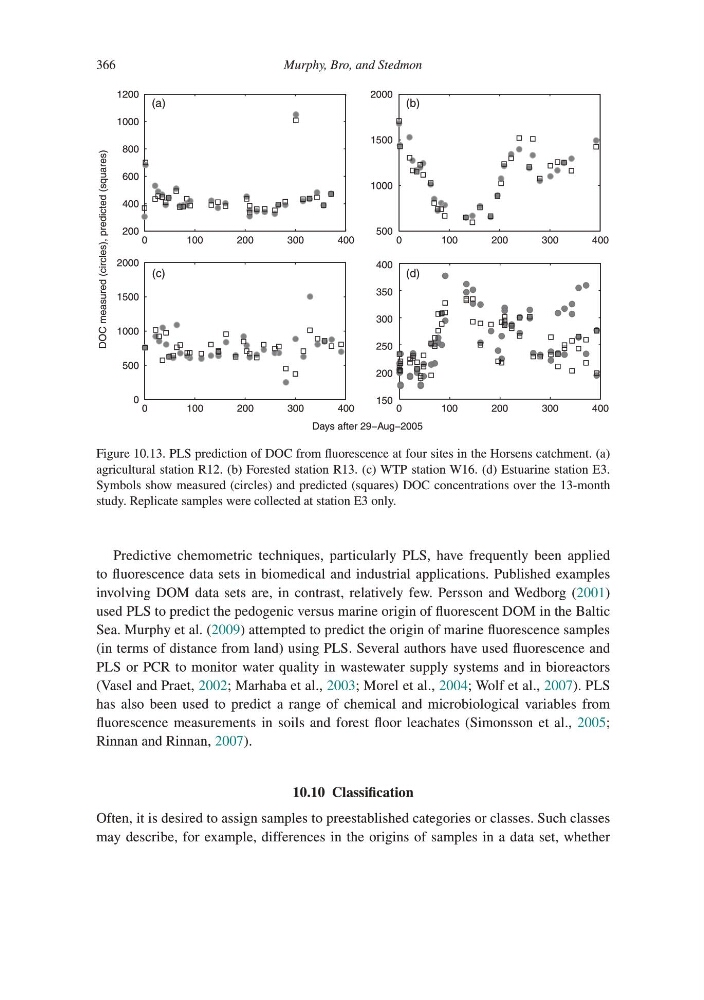
Figure 10.13. PLS prediction of DOC from fluorescence at four sites in the Horsens catchment. (a)
agricultural station R12. (b) Forested station R13. (c) WTP station W16. (d) Estuarine station E3.
Symbols show measured (circles) and predicted (squares) DOC concentrations over the 13-month
study. Replicate samples were collected at station E3 only.
366
Predictive chemometric techniques, particularly PLS, have frequently been applied
to fluorescence data sets in biomedical and industrial applications. Published examples
involving DOM data sets are, in contrast, relatively few. Persson and Wedborg (2001)
used PLS to predict the pedogenic versus marine origin of fluorescent DOM in the Baltic
Sea. Murphy et al. (2009) attempted to predict the origin of marine fluorescence samples
(in terms of distance from land) using PLS. Several authors have used fluorescence and
PLS or PCR to monitor water quality in wastewater supply systems and in bioreactors
(Vasel and Praet, 2002; Marhaba et al., 2003; Morel et al., 2004; Wolf et al., 2007). PLS
has also been used to predict a range of chemical and microbiological variables from
fluorescence measurements in soils and forest floor leachates (Simonsson et al., 2005;
Rinnan and Rinnan, 2007).
10.10 Classification
Often, it is desired to assign samples to preestablished categories or classes. Such classes
may describe, for example, differences in the origins of samples in a data set, whether
0
100
200
300
400
0
100
200
300
400
0
100
200
300
400
0
100
200
300
400
200
400
600
800
1000
1200
DOC measured (circles), predicted (squares)
500
1000
1500
2000
0
500
1000
1500
2000
Days after 29−Aug−2005
150
200
250
300
350
400
(a)
(c)
(b)
(d)
Figure 10.13. PLS prediction of DOC from fluorescence at four sites in the Horsens catchment. (a)
agricultural station R12. (b) Forested station R13. (c) WTP station W16. (d) Estuarine station E3.
Symbols show measured (circles) and predicted (squares) DOC concentrations over the 13-month
study. Replicate samples were collected at station E3 only.