

Murphy, Bro, and Stedmon
360
et al., 2006). The sampling station on the outflow of a wetland area in the Hansted system
(R14) has the highest concentrations of TDN and DON (Fig. 2 in Stedmon et al., 2006).
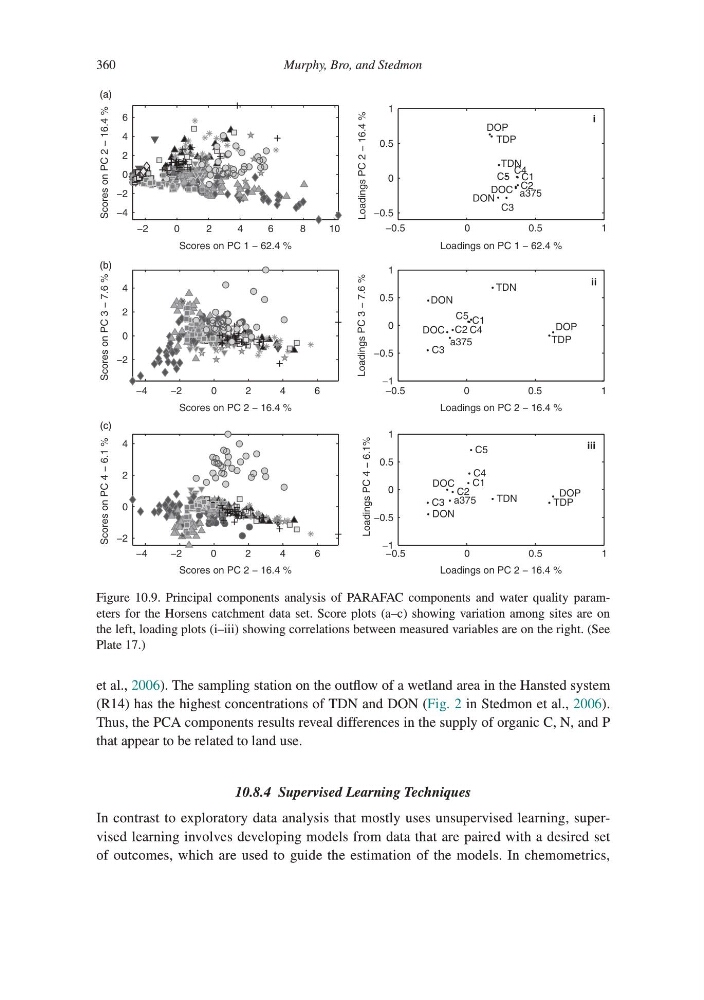
Thus, the PCA components results reveal differences in the supply of organic C, N, and P
that appear to be related to land use.
10.8.4 Supervised Learning Techniques
In contrast to exploratory data analysis that mostly uses unsupervised learning, supervised learning involves developing models from data that are paired with a desired set
of outcomes, which are used to guide the estimation of the models. In chemometrics,
−2
0
2
4
6
8
10
−4
−2
0
2
4
6
Scores on PC 1 − 62.4 %
Scores on PC 2 − 16.4 %
−0.5
0
0.5
1
−0.5
0
0.5
1
C1
C2
C3
C4
C5
a375
DOC
TDN
TDP
DON
DOP
Loadings on PC 1 − 62.4 %
Loadings PC 2 − 16.4 %
i
−4
−2
0
2
4
6
−2
0
2
4
Scores on PC 2 − 16.4 %
Scores on PC 3 − 7.6 %
−0.5
0
0.5
1
−1
−0.5
0
0.5
1
C1
C2
C3
C4
C5
a375
DOC
TDN
TDP
DON
DOP
Loadings on PC 2 − 16.4 %
Loadings PC 3 − 7.6 %
ii
−4
−2
0
2
4
6
−2
0
2
4
Scores on PC 2 − 16.4 %
Scores on PC 4 − 6.1 %
−0.5
0
0.5
1
−1
−0.5
0
0.5
1
C1
C2
C3
C4
C5
a375
DOC
TDN
TDP
DON
DOP
Loadings on PC 2 − 16.4 %
Loadings PC 4 − 6.1 %
iii
(a)
(b)
(c)
Figure 10.9. Principal components analysis of PARAFAC components and water quality parameters for the Horsens catchment data set. Score plots (a–c) showing variation among sites are on
the left, loading plots (i–iii) showing correlations between measured variables are on the right. (See
Plate 17.)
360
et al., 2006). The sampling station on the outflow of a wetland area in the Hansted system
(R14) has the highest concentrations of TDN and DON (Fig. 2 in Stedmon et al., 2006).
Thus, the PCA components results reveal differences in the supply of organic C, N, and P
that appear to be related to land use.
10.8.4 Supervised Learning Techniques
In contrast to exploratory data analysis that mostly uses unsupervised learning, supervised learning involves developing models from data that are paired with a desired set
of outcomes, which are used to guide the estimation of the models. In chemometrics,
−2
0
2
4
6
8
10
−4
−2
0
2
4
6
Scores on PC 1 − 62.4 %
Scores on PC 2 − 16.4 %
−0.5
0
0.5
1
−0.5
0
0.5
1
C1
C2
C3
C4
C5
a375
DOC
TDN
TDP
DON
DOP
Loadings on PC 1 − 62.4 %
Loadings PC 2 − 16.4 %
i
−4
−2
0
2
4
6
−2
0
2
4
Scores on PC 2 − 16.4 %
Scores on PC 3 − 7.6 %
−0.5
0
0.5
1
−1
−0.5
0
0.5
1
C1
C2
C3
C4
C5
a375
DOC
TDN
TDP
DON
DOP
Loadings on PC 2 − 16.4 %
Loadings PC 3 − 7.6 %
ii
−4
−2
0
2
4
6
−2
0
2
4
Scores on PC 2 − 16.4 %
Scores on PC 4 − 6.1 %
−0.5
0
0.5
1
−1
−0.5
0
0.5
1
C1
C2
C3
C4
C5
a375
DOC
TDN
TDP
DON
DOP
Loadings on PC 2 − 16.4 %
Loadings PC 4 − 6.1 %
iii
(a)
(b)
(c)
Figure 10.9. Principal components analysis of PARAFAC components and water quality parameters for the Horsens catchment data set. Score plots (a–c) showing variation among sites are on
the left, loading plots (i–iii) showing correlations between measured variables are on the right. (See
Plate 17.)