

Cheometric Analysis
351
sets from natural and artificial aquatic environments have found the greater part (>80%) of
fluorescence variability to be explained by just one or two principal components.
10.6 Parallel Factor Analysis
Parallel factor analysis (PARAFAC, less commonly termed canonical decomposition or
CANDECOMP), is a multiway decomposition method originating from the field of psychometrics (Carroll and Chang, 1970; Harshman and Lundy, 1994). Although its utility
for analyzing fluorescence data has been known for some years (Appellof and Davidson,
1981), its first applications to DOM fluorescence occurred relatively recently (Søndergaard
et al., 2003; Stedmon et al., 2003). PARAFAC is now widely applied in the study of DOM
fluorescence, with more than 90 PARAFAC studies of DOM in soils and natural water bodies published in 2005–2011, and a rapidly increasing number appearing in the engineering
literature related to monitoring of wastewaters and water treatment systems.
10.7 PARAFAC and Its Properties
The popularity of PARAFAC stems from its ability to mathematically separate the spectra of
overlapping fluorescence components. Hence, PARAFAC is similar to MCR mentioned earlier
(actually PARAFAC can be considered the three-way version of the two-way MCR) with the
important difference being that PARAFAC does not have rotational ambiguity as does MCR.
This means that if the model is correct, it will give chemically meaningful results. For a mathematical explanation of PARAFAC including tutorials on its application we refer the reader to
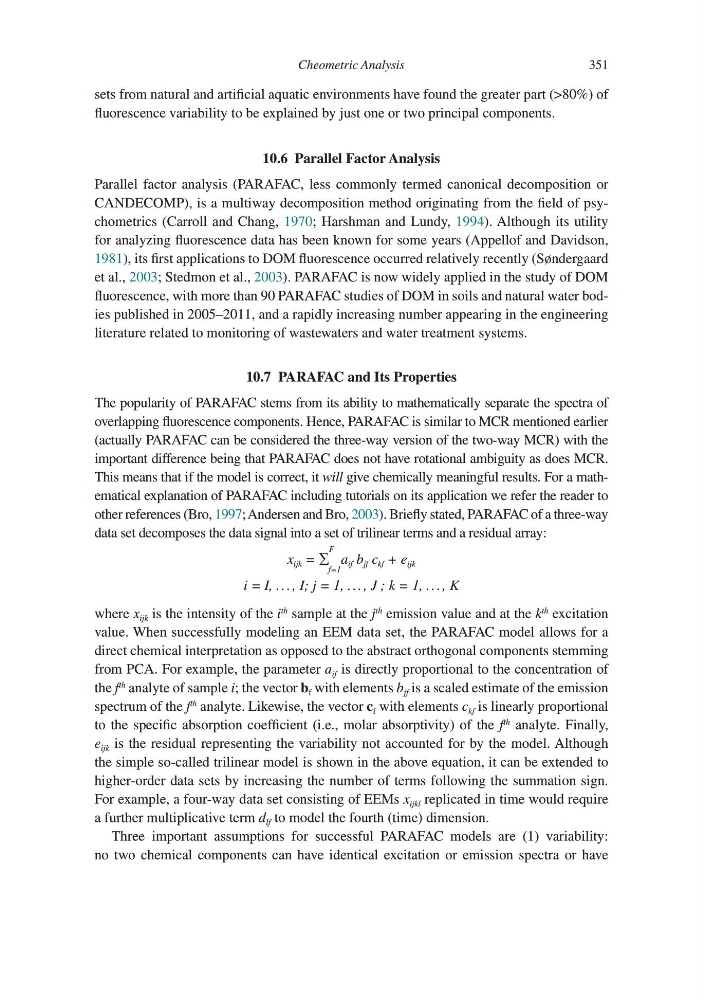
other references (Bro, 1997; Andersen and Bro, 2003). Briefly stated, PARAFAC of a three-way
data set decomposes the data signal into a set of trilinear terms and a residual array:
x ijk = ∑
F
f=1
a if b jf c kf + e ijk
i = I, . . . , I; j = 1, . . . , J ; k = 1, . . . , K
where x ijk is the intensity of the i
th
sample at the j
th
emission value and at the k
th
excitation
value. When successfully modeling an EEM data set, the PARAFAC model allows for a
direct chemical interpretation as opposed to the abstract orthogonal components stemming
from PCA. For example, the parameter a if is directly proportional to the concentration of
the f
th
analyte of sample i; the vector b f with elements b jf is a scaled estimate of the emission
spectrum of the f
th
analyte. Likewise, the vector c f with elements c kf is linearly proportional
to the specific absorption coefficient (i.e., molar absorptivity) of the f
th
analyte. Finally,
e ijk is the residual representing the variability not accounted for by the model. Although
the simple so-called trilinear model is shown in the above equation, it can be extended to
higher-order data sets by increasing the number of terms following the summation sign.
For example, a four-way data set consisting of EEMs x ijkl replicated in time would require
a further multiplicative term d lf to model the fourth (time) dimension.
Three important assumptions for successful PARAFAC models are (1) variability:
no two chemical components can have identical excitation or emission spectra or have
351
sets from natural and artificial aquatic environments have found the greater part (>80%) of
fluorescence variability to be explained by just one or two principal components.
10.6 Parallel Factor Analysis
Parallel factor analysis (PARAFAC, less commonly termed canonical decomposition or
CANDECOMP), is a multiway decomposition method originating from the field of psychometrics (Carroll and Chang, 1970; Harshman and Lundy, 1994). Although its utility
for analyzing fluorescence data has been known for some years (Appellof and Davidson,
1981), its first applications to DOM fluorescence occurred relatively recently (Søndergaard
et al., 2003; Stedmon et al., 2003). PARAFAC is now widely applied in the study of DOM
fluorescence, with more than 90 PARAFAC studies of DOM in soils and natural water bodies published in 2005–2011, and a rapidly increasing number appearing in the engineering
literature related to monitoring of wastewaters and water treatment systems.
10.7 PARAFAC and Its Properties
The popularity of PARAFAC stems from its ability to mathematically separate the spectra of
overlapping fluorescence components. Hence, PARAFAC is similar to MCR mentioned earlier
(actually PARAFAC can be considered the three-way version of the two-way MCR) with the
important difference being that PARAFAC does not have rotational ambiguity as does MCR.
This means that if the model is correct, it will give chemically meaningful results. For a mathematical explanation of PARAFAC including tutorials on its application we refer the reader to
other references (Bro, 1997; Andersen and Bro, 2003). Briefly stated, PARAFAC of a three-way
data set decomposes the data signal into a set of trilinear terms and a residual array:
x ijk = ∑
F
f=1
a if b jf c kf + e ijk
i = I, . . . , I; j = 1, . . . , J ; k = 1, . . . , K
where x ijk is the intensity of the i
th
sample at the j
th
emission value and at the k
th
excitation
value. When successfully modeling an EEM data set, the PARAFAC model allows for a
direct chemical interpretation as opposed to the abstract orthogonal components stemming
from PCA. For example, the parameter a if is directly proportional to the concentration of
the f
th
analyte of sample i; the vector b f with elements b jf is a scaled estimate of the emission
spectrum of the f
th
analyte. Likewise, the vector c f with elements c kf is linearly proportional
to the specific absorption coefficient (i.e., molar absorptivity) of the f
th
analyte. Finally,
e ijk is the residual representing the variability not accounted for by the model. Although
the simple so-called trilinear model is shown in the above equation, it can be extended to
higher-order data sets by increasing the number of terms following the summation sign.
For example, a four-way data set consisting of EEMs x ijkl replicated in time would require
a further multiplicative term d lf to model the fourth (time) dimension.
Three important assumptions for successful PARAFAC models are (1) variability:
no two chemical components can have identical excitation or emission spectra or have