

Murphy, Bro, and Stedmon
346
cluster analysis is used to discover structures in data without using prior knowledge of
why such should be present. A level of subjectivity in the interpretation of cluster analyses
is inevitable. In order that the clusters identified represent chemically distinct groupings
rather than happenstance correlations the researcher should establish what degree of clustering is sensible both visually and through validation with additional samples and alternative clustering methods (Bratchell, 1989).
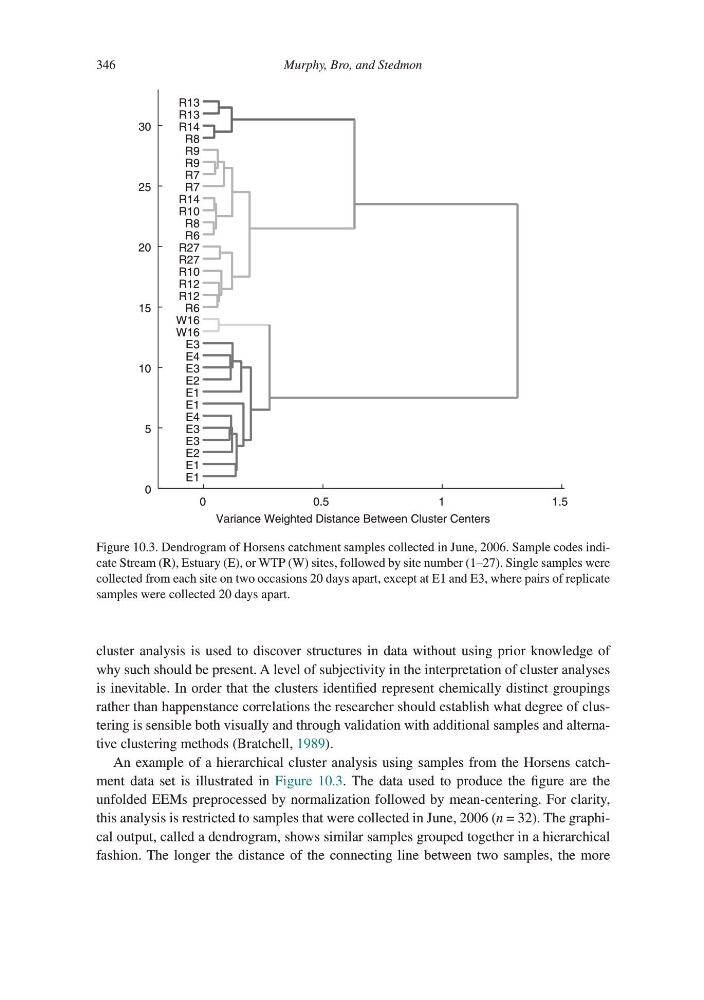
An example of a hierarchical cluster analysis using samples from the Horsens catchment data set is illustrated in Figure 10.3. The data used to produce the figure are the
unfolded EEMs preprocessed by normalization followed by mean-centering. For clarity,
this analysis is restricted to samples that were collected in June, 2006 (n = 32). The graphical output, called a dendrogram, shows similar samples grouped together in a hierarchical
fashion. The longer the distance of the connecting line between two samples, the more
Variance Weighted Distance Between Cluster Centers
0
0.5
1
1.5
0
5
10
15
20
25
30
E1
E1
E2
E3
E3
E4
E1
E1
E2
E3
E4
E3
W16
W16
R6
R12
R12
R10
R27
R27
R6
R8
R10
R14
R7
R7
R9
R9
R8
R14
R13
R13
Figure 10.3. Dendrogram of Horsens catchment samples collected in June, 2006. Sample codes indicate Stream (R), Estuary (E), or WTP (W) sites, followed by site number (1–27). Single samples were
collected from each site on two occasions 20 days apart, except at E1 and E3, where pairs of replicate
samples were collected 20 days apart.
346
cluster analysis is used to discover structures in data without using prior knowledge of
why such should be present. A level of subjectivity in the interpretation of cluster analyses
is inevitable. In order that the clusters identified represent chemically distinct groupings
rather than happenstance correlations the researcher should establish what degree of clustering is sensible both visually and through validation with additional samples and alternative clustering methods (Bratchell, 1989).
An example of a hierarchical cluster analysis using samples from the Horsens catchment data set is illustrated in Figure 10.3. The data used to produce the figure are the
unfolded EEMs preprocessed by normalization followed by mean-centering. For clarity,
this analysis is restricted to samples that were collected in June, 2006 (n = 32). The graphical output, called a dendrogram, shows similar samples grouped together in a hierarchical
fashion. The longer the distance of the connecting line between two samples, the more
Variance Weighted Distance Between Cluster Centers
0
0.5
1
1.5
0
5
10
15
20
25
30
E1
E1
E2
E3
E3
E4
E1
E1
E2
E3
E4
E3
W16
W16
R6
R12
R12
R10
R27
R27
R6
R8
R10
R14
R7
R7
R9
R9
R8
R14
R13
R13
Figure 10.3. Dendrogram of Horsens catchment samples collected in June, 2006. Sample codes indicate Stream (R), Estuary (E), or WTP (W) sites, followed by site number (1–27). Single samples were
collected from each site on two occasions 20 days apart, except at E1 and E3, where pairs of replicate
samples were collected 20 days apart.