

Murphy, Bro, and Stedmon
342
even in a mixture that contains uncalibrated signals associated with chemical interferents
(Bro, 2003).
The methods and examples in this chapter are focused primarily on multiway and multivariate analyses of threeway fluorescence EEMs. However, many of the techniques discussed can be applied to other multivariate fluorescence data, such as data sets consisting of
spectra obtained by scanning at fixed wavelength, or from synchronous scans. In synchronous scan spectroscopy, scans are performed using a fixed wavelength offset (δλ) between
the excitation and emission monochromators, producing profiles of signal strength versus
wavelength (em = ex + δλ) with shapes and peak resolutions that depend on δλ (Miano and
Senesi, 1992; Sierra et al., 2005). These synchronous scans can be visualized as diagonal
slices through EEMs that intersect with various EEM features according to the value of
δλ (Sierra et al., 2005). It is possible to both analyze a multivariate data set arising from
single-offset synchronous scans, and to build a multiway EEM data set by compiling a set
of synchronous scan spectra obtained with incrementally increased offsets.
10.3 Preprocessing of Data Matrices and Arrays
Data preprocessing is an important component of successfully implementing multivariate
analyses; however, how best to preprocess fluorescence data sets is frequently a point of
confusion. Both the type and order of preprocessing steps, and whether these are applied
to rows (samples) or columns (variables), can affect the results (Bro and Smilde, 2003).
5 variables
5 variables
5 variables
I � 5 matrix
I � 5 matrix
I � 5 � 4
matrix
I
samples
I
samples
I
samples
temperature 1 temperature 2 temperature 3 temperature 4
temperatures
4
Three-way array
Three-way array unfolded to a matrix
Two-way matrix
(c)
(a)
(b)
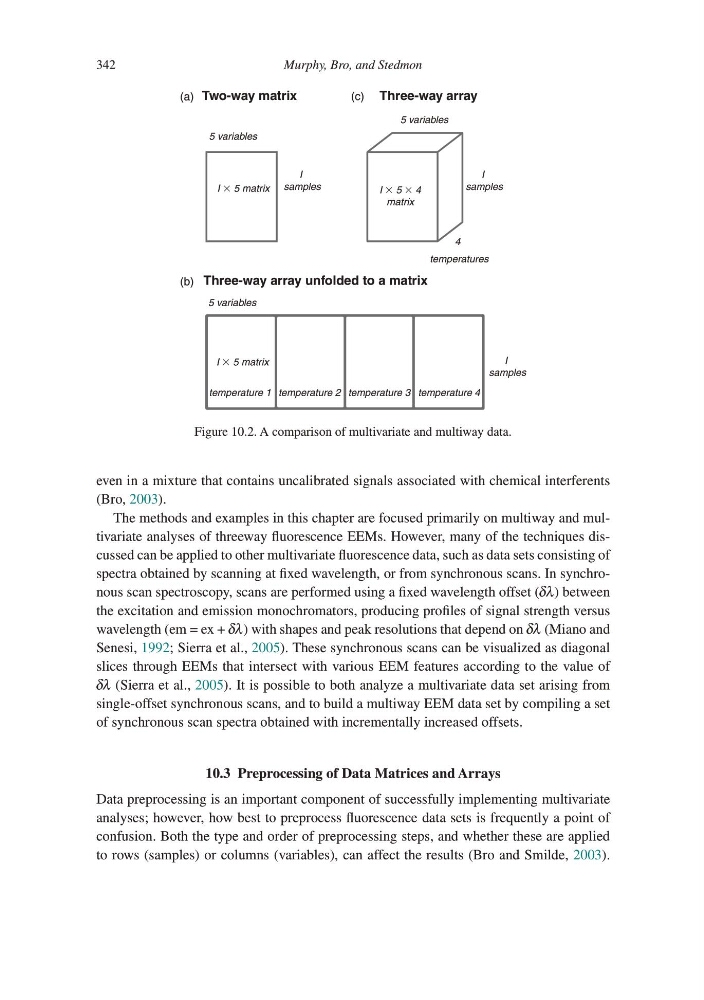
Figure 10.2. A comparison of multivariate and multiway data.
342
even in a mixture that contains uncalibrated signals associated with chemical interferents
(Bro, 2003).
The methods and examples in this chapter are focused primarily on multiway and multivariate analyses of threeway fluorescence EEMs. However, many of the techniques discussed can be applied to other multivariate fluorescence data, such as data sets consisting of
spectra obtained by scanning at fixed wavelength, or from synchronous scans. In synchronous scan spectroscopy, scans are performed using a fixed wavelength offset (δλ) between
the excitation and emission monochromators, producing profiles of signal strength versus
wavelength (em = ex + δλ) with shapes and peak resolutions that depend on δλ (Miano and
Senesi, 1992; Sierra et al., 2005). These synchronous scans can be visualized as diagonal
slices through EEMs that intersect with various EEM features according to the value of
δλ (Sierra et al., 2005). It is possible to both analyze a multivariate data set arising from
single-offset synchronous scans, and to build a multiway EEM data set by compiling a set
of synchronous scan spectra obtained with incrementally increased offsets.
10.3 Preprocessing of Data Matrices and Arrays
Data preprocessing is an important component of successfully implementing multivariate
analyses; however, how best to preprocess fluorescence data sets is frequently a point of
confusion. Both the type and order of preprocessing steps, and whether these are applied
to rows (samples) or columns (variables), can affect the results (Bro and Smilde, 2003).
5 variables
5 variables
5 variables
I � 5 matrix
I � 5 matrix
I � 5 � 4
matrix
I
samples
I
samples
I
samples
temperature 1 temperature 2 temperature 3 temperature 4
temperatures
4
Three-way array
Three-way array unfolded to a matrix
Two-way matrix
(c)
(a)
(b)
Figure 10.2. A comparison of multivariate and multiway data.