

Fluorescence Indices and Their Interpretation
325
An important advance in this approach has been the use of a laser excitation, which
permits micron-scale excitation of organic matter in the stalagmite samples, equivalent to a
sub-annual time resolution (Perrette et al., 2005). Thus, laser excitation has the possibility
of high-resolution reconstructions of past organic matter fluxes. Perrette et al. (2005) developed an index based on excitation at 364 nm for use with a laser light source. Conceptually,
the Perrette et al. (2005) fluorescence index is almost identical (although inverse) to the
McKnight et al. (2001) FI and the index used by Proctor et al. (2000). Emitted fluorescence
was detected at 514 and 457 nm, and the ratio of these values used to obtain a fluorescence
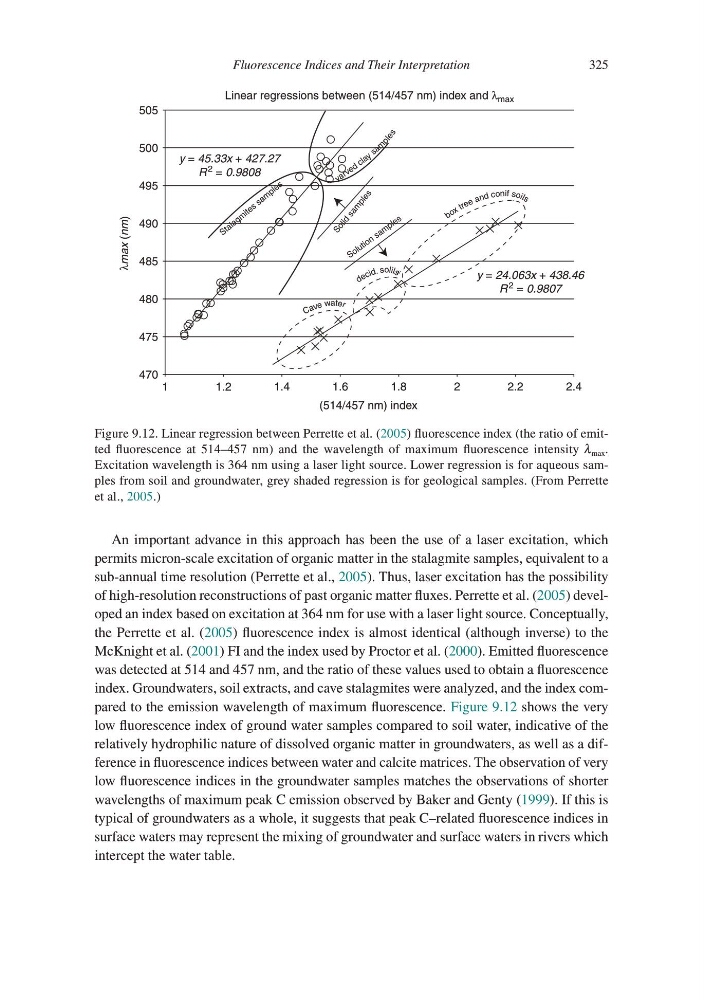
index. Groundwaters, soil extracts, and cave stalagmites were analyzed, and the index compared to the emission wavelength of maximum fluorescence. Figure 9.12 shows the very
low fluorescence index of ground water samples compared to soil water, indicative of the
relatively hydrophilic nature of dissolved organic matter in groundwaters, as well as a difference in fluorescence indices between water and calcite matrices. The observation of very
low fluorescence indices in the groundwater samples matches the observations of shorter
wavelengths of maximum peak C emission observed by Baker and Genty (1999). If this is
typical of groundwaters as a whole, it suggests that peak C–related fluorescence indices in
surface waters may represent the mixing of groundwater and surface waters in rivers which
intercept the water table.
1
1.2
470
475
480
485
S o li d
s a m
p le
s
S t a la g m
it e s s a m
p le s
S o lu ti o n s a m p le s
490
Linear regressions between (514/457 nm) index and λ max
λmax (nm)
495
500
505
1.4
1.6
1.8
(514/457 nm) index
2
y = 24.063x + 438.46
R
2 = 0.9807
y = 45.33x + 427.27
R
2 = 0.9808
2.2
2.4
C a ve water
b o x tr e e a nd conif so ils
d e c id . solils
v a r v e d
c la y s a m
p le
s
Figure 9.12. Linear regression between Perrette et al. (2005) fluorescence index (the ratio of emitted fluorescence at 514–457 nm) and the wavelength of maximum fluorescence intensity λ max .
Excitation wavelength is 364 nm using a laser light source. Lower regression is for aqueous samples from soil and groundwater, grey shaded regression is for geological samples. (From Perrette
et al., 2005.)
325
An important advance in this approach has been the use of a laser excitation, which
permits micron-scale excitation of organic matter in the stalagmite samples, equivalent to a
sub-annual time resolution (Perrette et al., 2005). Thus, laser excitation has the possibility
of high-resolution reconstructions of past organic matter fluxes. Perrette et al. (2005) developed an index based on excitation at 364 nm for use with a laser light source. Conceptually,
the Perrette et al. (2005) fluorescence index is almost identical (although inverse) to the
McKnight et al. (2001) FI and the index used by Proctor et al. (2000). Emitted fluorescence
was detected at 514 and 457 nm, and the ratio of these values used to obtain a fluorescence
index. Groundwaters, soil extracts, and cave stalagmites were analyzed, and the index compared to the emission wavelength of maximum fluorescence. Figure 9.12 shows the very
low fluorescence index of ground water samples compared to soil water, indicative of the
relatively hydrophilic nature of dissolved organic matter in groundwaters, as well as a difference in fluorescence indices between water and calcite matrices. The observation of very
low fluorescence indices in the groundwater samples matches the observations of shorter
wavelengths of maximum peak C emission observed by Baker and Genty (1999). If this is
typical of groundwaters as a whole, it suggests that peak C–related fluorescence indices in
surface waters may represent the mixing of groundwater and surface waters in rivers which
intercept the water table.
1
1.2
470
475
480
485
S o li d
s a m
p le
s
S t a la g m
it e s s a m
p le s
S o lu ti o n s a m p le s
490
Linear regressions between (514/457 nm) index and λ max
λmax (nm)
495
500
505
1.4
1.6
1.8
(514/457 nm) index
2
y = 24.063x + 438.46
R
2 = 0.9807
y = 45.33x + 427.27
R
2 = 0.9808
2.2
2.4
C a ve water
b o x tr e e a nd conif so ils
d e c id . solils
v a r v e d
c la y s a m
p le
s
Figure 9.12. Linear regression between Perrette et al. (2005) fluorescence index (the ratio of emitted fluorescence at 514–457 nm) and the wavelength of maximum fluorescence intensity λ max .
Excitation wavelength is 364 nm using a laser light source. Lower regression is for aqueous samples from soil and groundwater, grey shaded regression is for geological samples. (From Perrette
et al., 2005.)