

Gabor, Baker, McKnight, and Miller
318
peak T/peak C ratio of around 1.0, showing a distinctive fluorescence EEM with high
protein-like and fulvic-like peaks in approximately equal ratio. Downstream of the sewage
discharge the EEMs continued to show the discharge signal, with the ratio slowly decreasing due to dilution effects.
Subsequent research has demonstrated that peak T fluorescence intensity is strongly
correlated with biological oxygen demand in both river waters and final treated sewage
effluents (Hudson et al., 2008). Together with the observation that peak C fluorescence
intensity correlates with dissolved organic matter concentration for individual rivers, the
peak T/peak C ratio can be conceptualized as a BOD/DOC ratio in terrestrial waters, and
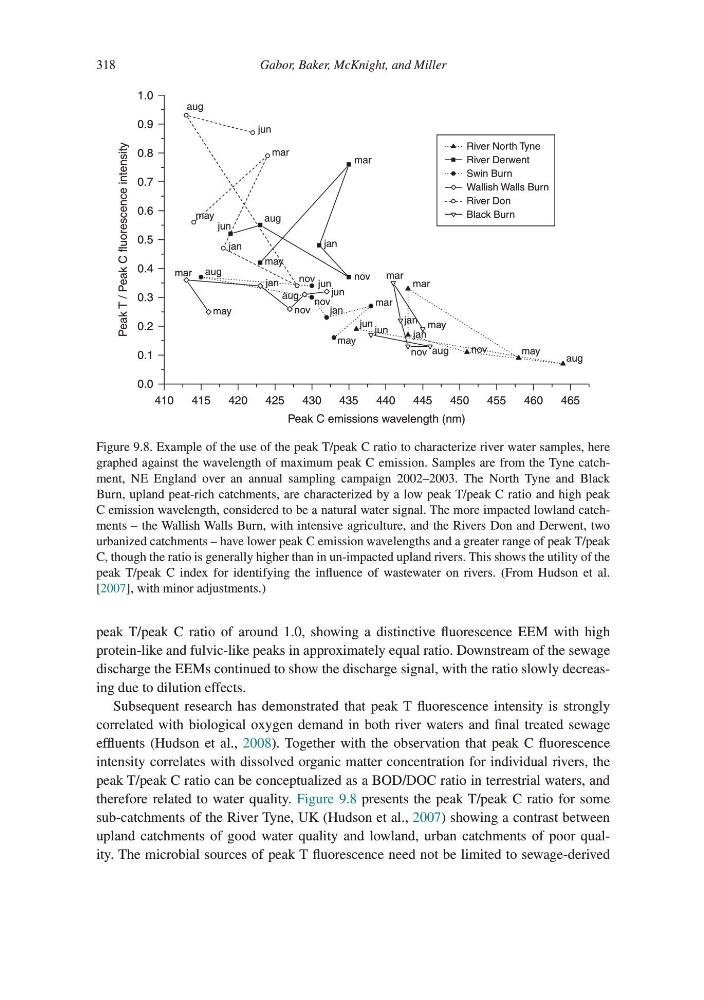
therefore related to water quality. Figure 9.8 presents the peak T/peak C ratio for some
sub-catchments of the River Tyne, UK (Hudson et al., 2007) showing a contrast between
upland catchments of good water quality and lowland, urban catchments of poor quality. The microbial sources of peak T fluorescence need not be limited to sewage-derived
410
0.0
0.1
0.2
0.3
0.4
0.5
Peak T / Peak C fluorescence intensity
0.6
0.7
0.8
0.9
1.0
415
420
mar
mar
mar mar
mar
mar
nov
nov
nov
nov
nov
nov
aug
aug
may
may
may
may
may
jun
jun
jun jun
jun
jan
jan
jan
jan
jan
jan
jun
aug
aug
aug
aug
may
425
430
435
Peak C emissions wavelength (nm)
440
445
450
455
460
465
River North Tyne
River Derwent
Swin Burn
Wallish Walls Burn
River Don
Black Burn
Figure 9.8. Example of the use of the peak T/peak C ratio to characterize river water samples, here
graphed against the wavelength of maximum peak C emission. Samples are from the Tyne catchment, NE England over an annual sampling campaign 2002–2003. The North Tyne and Black
Burn, upland peat-rich catchments, are characterized by a low peak T/peak C ratio and high peak
C emission wavelength, considered to be a natural water signal. The more impacted lowland catchments – the Wallish Walls Burn, with intensive agriculture, and the Rivers Don and Derwent, two
urbanized catchments – have lower peak C emission wavelengths and a greater range of peak T/peak
C, though the ratio is generally higher than in un-impacted upland rivers. This shows the utility of the
peak T/peak C index for identifying the influence of wastewater on rivers. (From Hudson et al.
[2007], with minor adjustments.)
318
peak T/peak C ratio of around 1.0, showing a distinctive fluorescence EEM with high
protein-like and fulvic-like peaks in approximately equal ratio. Downstream of the sewage
discharge the EEMs continued to show the discharge signal, with the ratio slowly decreasing due to dilution effects.
Subsequent research has demonstrated that peak T fluorescence intensity is strongly
correlated with biological oxygen demand in both river waters and final treated sewage
effluents (Hudson et al., 2008). Together with the observation that peak C fluorescence
intensity correlates with dissolved organic matter concentration for individual rivers, the
peak T/peak C ratio can be conceptualized as a BOD/DOC ratio in terrestrial waters, and
therefore related to water quality. Figure 9.8 presents the peak T/peak C ratio for some
sub-catchments of the River Tyne, UK (Hudson et al., 2007) showing a contrast between
upland catchments of good water quality and lowland, urban catchments of poor quality. The microbial sources of peak T fluorescence need not be limited to sewage-derived
410
0.0
0.1
0.2
0.3
0.4
0.5
Peak T / Peak C fluorescence intensity
0.6
0.7
0.8
0.9
1.0
415
420
mar
mar
mar mar
mar
mar
nov
nov
nov
nov
nov
nov
aug
aug
may
may
may
may
may
jun
jun
jun jun
jun
jan
jan
jan
jan
jan
jan
jun
aug
aug
aug
aug
may
425
430
435
Peak C emissions wavelength (nm)
440
445
450
455
460
465
River North Tyne
River Derwent
Swin Burn
Wallish Walls Burn
River Don
Black Burn
Figure 9.8. Example of the use of the peak T/peak C ratio to characterize river water samples, here
graphed against the wavelength of maximum peak C emission. Samples are from the Tyne catchment, NE England over an annual sampling campaign 2002–2003. The North Tyne and Black
Burn, upland peat-rich catchments, are characterized by a low peak T/peak C ratio and high peak
C emission wavelength, considered to be a natural water signal. The more impacted lowland catchments – the Wallish Walls Burn, with intensive agriculture, and the Rivers Don and Derwent, two
urbanized catchments – have lower peak C emission wavelengths and a greater range of peak T/peak
C, though the ratio is generally higher than in un-impacted upland rivers. This shows the utility of the
peak T/peak C index for identifying the influence of wastewater on rivers. (From Hudson et al.
[2007], with minor adjustments.)