

Fluorescence Indices and Their Interpretation
305
inability of in situ detectors to measure multiple wavelengths. It can be anticipated that in
the future, in situ fluorometers will be developed that have the capabilities to measure a full
EEM with reasonable spectral resolution. In either case, these fluorescence measurements
result in large quantities of spectral data requiring analysis to be interpreted in a meaningful
manner. In laboratory measurements with a modern scanning fluorometer, one EEM typically represents a large amount (typically 2000–3000 wavelength pairs) of data. Similarly,
550
500
450
400
A
M
C
B
Emission Wavelength, nm
350
300
550
500
450
400
T/C
BIX
BIX
HIX
T/C
HIX S-WW
HIX S-WW
HIX S-FA
FI
FI
HIX S-FA
HIX S-FA
EM
EM
HIX
Emission Wavelength, nm
350
300
250
300
350
400
450
Excitation Wavelength, nm
500
(a)
250
300
350
400
450
Excitation Wavelength, nm
500
(b)
HIX S-FA Fulvic Acid (HIX S-FA )
HIX SYN Whole Water (HIX S-ww )
HIX EM
HIX
FI
Peak T/ Peak C (T/C)
A = humic-like
B = tyrosine-like
C = humic-like
M = marine humic-like
T = tryptophan-like
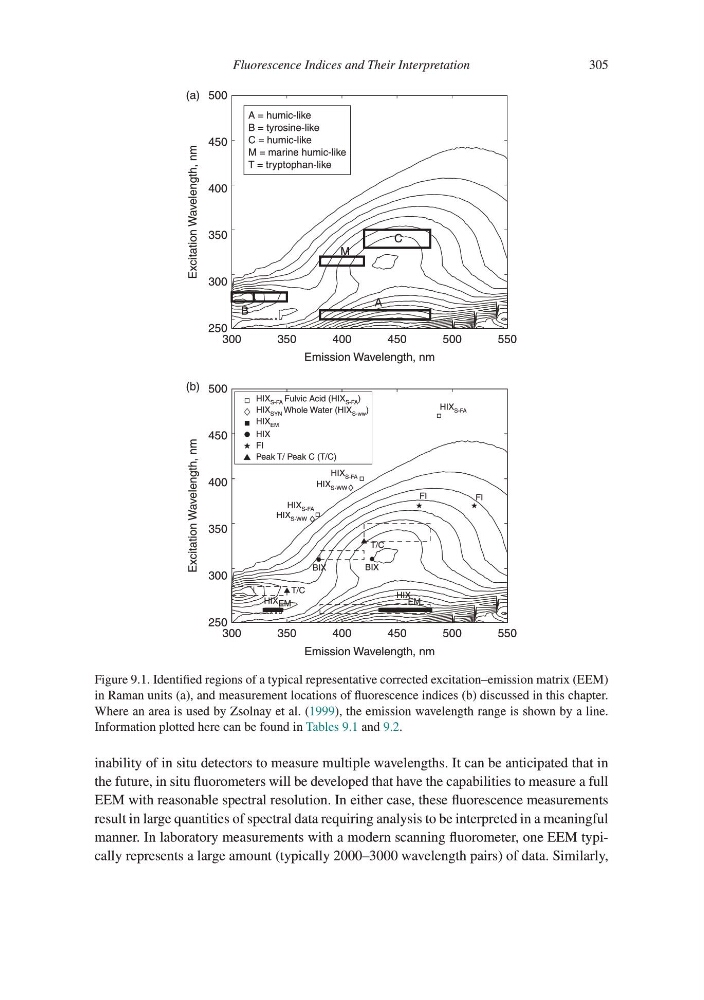
Figure 9.1. Identified regions of a typical representative corrected excitation–emission matrix (EEM)
in Raman units (a), and measurement locations of fluorescence indices (b) discussed in this chapter.
Where an area is used by Zsolnay et al. (1999), the emission wavelength range is shown by a line.
Information plotted here can be found in Tables 9.1 and 9.2.
305
inability of in situ detectors to measure multiple wavelengths. It can be anticipated that in
the future, in situ fluorometers will be developed that have the capabilities to measure a full
EEM with reasonable spectral resolution. In either case, these fluorescence measurements
result in large quantities of spectral data requiring analysis to be interpreted in a meaningful
manner. In laboratory measurements with a modern scanning fluorometer, one EEM typically represents a large amount (typically 2000–3000 wavelength pairs) of data. Similarly,
550
500
450
400
A
M
C
B
Emission Wavelength, nm
350
300
550
500
450
400
T/C
BIX
BIX
HIX
T/C
HIX S-WW
HIX S-WW
HIX S-FA
FI
FI
HIX S-FA
HIX S-FA
EM
EM
HIX
Emission Wavelength, nm
350
300
250
300
350
400
450
Excitation Wavelength, nm
500
(a)
250
300
350
400
450
Excitation Wavelength, nm
500
(b)
HIX S-FA Fulvic Acid (HIX S-FA )
HIX SYN Whole Water (HIX S-ww )
HIX EM
HIX
FI
Peak T/ Peak C (T/C)
A = humic-like
B = tyrosine-like
C = humic-like
M = marine humic-like
T = tryptophan-like
Figure 9.1. Identified regions of a typical representative corrected excitation–emission matrix (EEM)
in Raman units (a), and measurement locations of fluorescence indices (b) discussed in this chapter.
Where an area is used by Zsolnay et al. (1999), the emission wavelength range is shown by a line.
Information plotted here can be found in Tables 9.1 and 9.2.