

Osburn, Del Vecchio, and Boyd
256
however, showed almost no variability in peak or modeled data. The B peak component
modeled in river to ocean transects by Yamashita et al. (2008) also showed similar behavior
in which no clear trend was observed with salinity.
Alberts et al. (2004) studied DOM fluorescence effects of a CDOM-rich river fractionated into three molecular weight size classes (<10 kDa, 10–50 kDa, and >50 kDa) and
mixed at increasing salinity. The dominant EEM peak studied was the C-peak (ex 355/
em 450) and its behavior was observed during mixing for each size fraction. Blue shifting
0.00
2.00
4.00
6.00
8.00
10.00
12.00
(a)
(b)
0
2 0
4 0
6 0
0
2 0
4 0
6 0
Fl.I. (R.U.)
INT peak (M-C)
C peak
M peak
0
50
100
150
200
250
300
350
400
450
Electrical conductivity (mS cm –1 )
Fl.I. (A.U.)
Hydrophilic
Hydrophobic
Ex325/Em400
Ex275/Em465
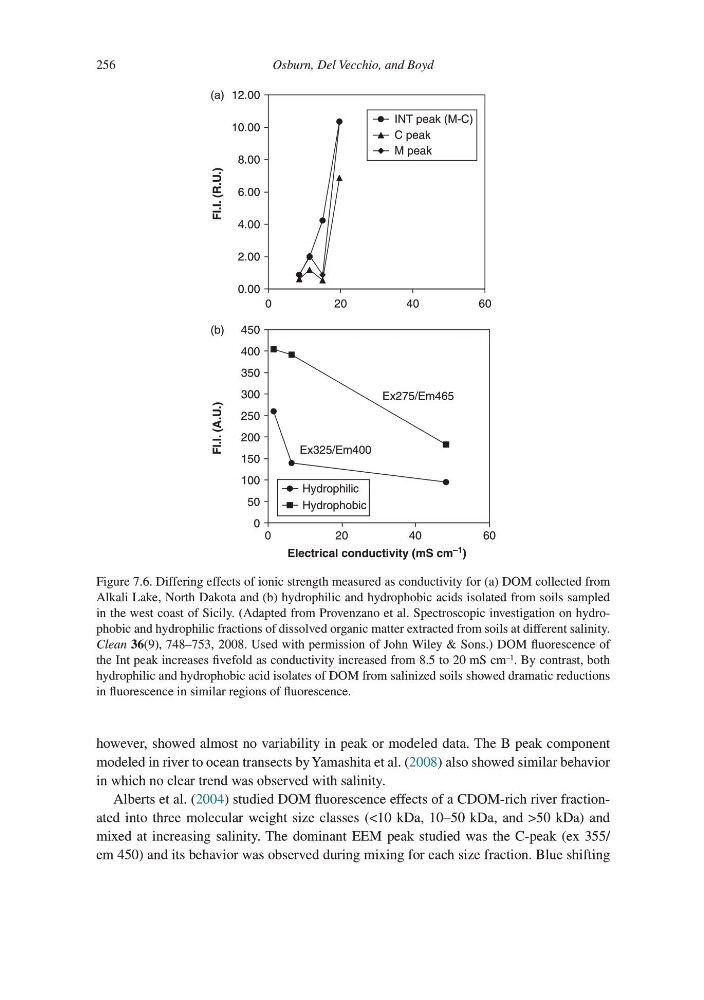
Figure 7.6. Differing effects of ionic strength measured as conductivity for (a) DOM collected from
Alkali Lake, North Dakota and (b) hydrophilic and hydrophobic acids isolated from soils sampled
in the west coast of Sicily. (Adapted from Provenzano et al. Spectroscopic investigation on hydrophobic and hydrophilic fractions of dissolved organic matter extracted from soils at different salinity.
Clean 36(9), 748–753, 2008. Used with permission of John Wiley & Sons.) DOM fluorescence of
the Int peak increases fivefold as conductivity increased from 8.5 to 20 mS cm
–1
. By contrast, both
hydrophilic and hydrophobic acid isolates of DOM from salinized soils showed dramatic reductions
in fluorescence in similar regions of fluorescence.
256
however, showed almost no variability in peak or modeled data. The B peak component
modeled in river to ocean transects by Yamashita et al. (2008) also showed similar behavior
in which no clear trend was observed with salinity.
Alberts et al. (2004) studied DOM fluorescence effects of a CDOM-rich river fractionated into three molecular weight size classes (<10 kDa, 10–50 kDa, and >50 kDa) and
mixed at increasing salinity. The dominant EEM peak studied was the C-peak (ex 355/
em 450) and its behavior was observed during mixing for each size fraction. Blue shifting
0.00
2.00
4.00
6.00
8.00
10.00
12.00
(a)
(b)
0
2 0
4 0
6 0
0
2 0
4 0
6 0
Fl.I. (R.U.)
INT peak (M-C)
C peak
M peak
0
50
100
150
200
250
300
350
400
450
Electrical conductivity (mS cm –1 )
Fl.I. (A.U.)
Hydrophilic
Hydrophobic
Ex325/Em400
Ex275/Em465
Figure 7.6. Differing effects of ionic strength measured as conductivity for (a) DOM collected from
Alkali Lake, North Dakota and (b) hydrophilic and hydrophobic acids isolated from soils sampled
in the west coast of Sicily. (Adapted from Provenzano et al. Spectroscopic investigation on hydrophobic and hydrophilic fractions of dissolved organic matter extracted from soils at different salinity.
Clean 36(9), 748–753, 2008. Used with permission of John Wiley & Sons.) DOM fluorescence of
the Int peak increases fivefold as conductivity increased from 8.5 to 20 mS cm
–1
. By contrast, both
hydrophilic and hydrophobic acid isolates of DOM from salinized soils showed dramatic reductions
in fluorescence in similar regions of fluorescence.