

Osburn, Del Vecchio, and Boyd
254
saline lakes (Arts et al., 2000; Anderson and Stedmon, 2007; Mariot et al., 2007; OrtegaRetuerta et al., 2007). Although evapoconcentration appears to be a forcing factor on DOM
fluorescence as salts, and hence ionic strength, increase along with organic matter, Osburn
et al. (2011) also suggested that microbial processing of DOM in saline lakes exerts an
influence on fluorescence properties in these ecosystems, rather than a strict concentration
of allochthonous fluorescent DOM.
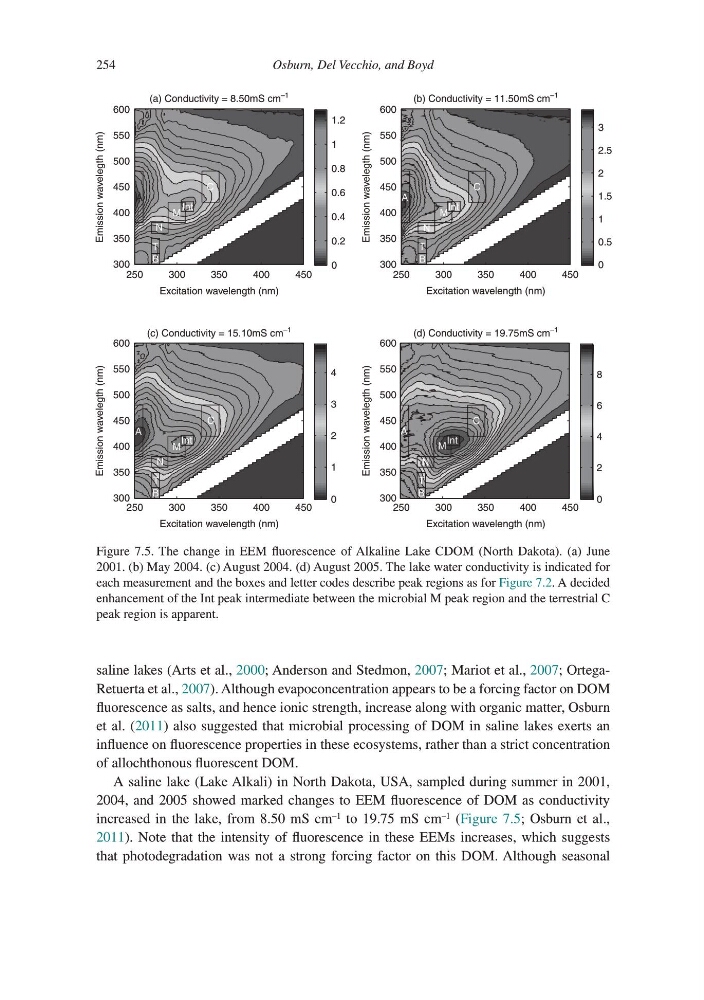
A saline lake (Lake Alkali) in North Dakota, USA, sampled during summer in 2001,
2004, and 2005 showed marked changes to EEM fluorescence of DOM as conductivity
increased in the lake, from 8.50 mS cm
–1
to 19.75 mS cm
–1
(Figure 7.5; Osburn et al.,
2011). Note that the intensity of fluorescence in these EEMs increases, which suggests
that photodegradation was not a strong forcing factor on this DOM. Although seasonal
(a) Conductivity = 8.50mS cm
–1
(b) Conductivity = 11.50mS cm
–1
(c) Conductivity = 15.10mS cm
–1
(d) Conductivity = 19.75mS cm
–1
C
A
M
N
B
T
Int
0
0.5
1
1.5
2
2.5
3
C
A
M
N
B
T
Int
0
2
4
6
8
C
A
M
N
B
T
Int
0
1
2
3
4
C
A
M
N
B
T
Int
Excitation wavelength (nm)
Emission wavelegth (nm)
250
300
350
400
450
300
350
400
450
500
550
600
Excitation wavelength (nm)
Emission wavelegth (nm)
250
300
350
400
450
Excitation wavelength (nm)
250
300
350
400
450
Excitation wavelength (nm)
250
300
350
400
450
300
350
400
450
500
550
600
Emission wavelegth (nm)
300
350
400
450
500
550
600
Emission wavelegth (nm)
300
350
400
450
500
550
600
0
0.2
0.4
0.6
0.8
1
1.2
Figure 7.5. The change in EEM fluorescence of Alkaline Lake CDOM (North Dakota). (a) June
2001. (b) May 2004. (c) August 2004. (d) August 2005. The lake water conductivity is indicated for
each measurement and the boxes and letter codes describe peak regions as for Figure 7.2. A decided
enhancement of the Int peak intermediate between the microbial M peak region and the terrestrial C
peak region is apparent.
254
saline lakes (Arts et al., 2000; Anderson and Stedmon, 2007; Mariot et al., 2007; OrtegaRetuerta et al., 2007). Although evapoconcentration appears to be a forcing factor on DOM
fluorescence as salts, and hence ionic strength, increase along with organic matter, Osburn
et al. (2011) also suggested that microbial processing of DOM in saline lakes exerts an
influence on fluorescence properties in these ecosystems, rather than a strict concentration
of allochthonous fluorescent DOM.
A saline lake (Lake Alkali) in North Dakota, USA, sampled during summer in 2001,
2004, and 2005 showed marked changes to EEM fluorescence of DOM as conductivity
increased in the lake, from 8.50 mS cm
–1
to 19.75 mS cm
–1
(Figure 7.5; Osburn et al.,
2011). Note that the intensity of fluorescence in these EEMs increases, which suggests
that photodegradation was not a strong forcing factor on this DOM. Although seasonal
(a) Conductivity = 8.50mS cm
–1
(b) Conductivity = 11.50mS cm
–1
(c) Conductivity = 15.10mS cm
–1
(d) Conductivity = 19.75mS cm
–1
C
A
M
N
B
T
Int
0
0.5
1
1.5
2
2.5
3
C
A
M
N
B
T
Int
0
2
4
6
8
C
A
M
N
B
T
Int
0
1
2
3
4
C
A
M
N
B
T
Int
Excitation wavelength (nm)
Emission wavelegth (nm)
250
300
350
400
450
300
350
400
450
500
550
600
Excitation wavelength (nm)
Emission wavelegth (nm)
250
300
350
400
450
Excitation wavelength (nm)
250
300
350
400
450
Excitation wavelength (nm)
250
300
350
400
450
300
350
400
450
500
550
600
Emission wavelegth (nm)
300
350
400
450
500
550
600
Emission wavelegth (nm)
300
350
400
450
500
550
600
0
0.2
0.4
0.6
0.8
1
1.2
Figure 7.5. The change in EEM fluorescence of Alkaline Lake CDOM (North Dakota). (a) June
2001. (b) May 2004. (c) August 2004. (d) August 2005. The lake water conductivity is indicated for
each measurement and the boxes and letter codes describe peak regions as for Figure 7.2. A decided
enhancement of the Int peak intermediate between the microbial M peak region and the terrestrial C
peak region is apparent.