

Experimental Design and Quality Assurance
221
6.6.2.3 Mississippi Bight Region – Large Spatial and Temporal Scales
Examining the Mississippi River plume over large spatial and temporal scales using a towed,
undulating vehicle has demonstrated time-varying freshwater endmembers and evidence of
seasonal DOM photobleaching in this region (Chen and Gardner, 2004). This sampling
strategy allowed for observing thin layers of high-CDOM waters below the seaward edge
–74.15
–74.10
–74.05
–74.00
–73.95
–74.15
–74.10
–74.05
–74.00
–73.95
40.6
40.8
(a)
(b)
(c)
G.Washington Bridge
Manhatten
Upper New York Bay
Lower New York Bay
Newark Bay
Hudson River
Staten Island
Long Island
East River
Longitude
Latitude
G.Washington Bridge
Manhatten
Upper New York Bay
Lower New York Bay
Newark Bay
Hudson River
Staten Island
Long Island
East River
0
0.0
0.5
1.0
CDOM Fluorometer/V
1.5
10
20
30
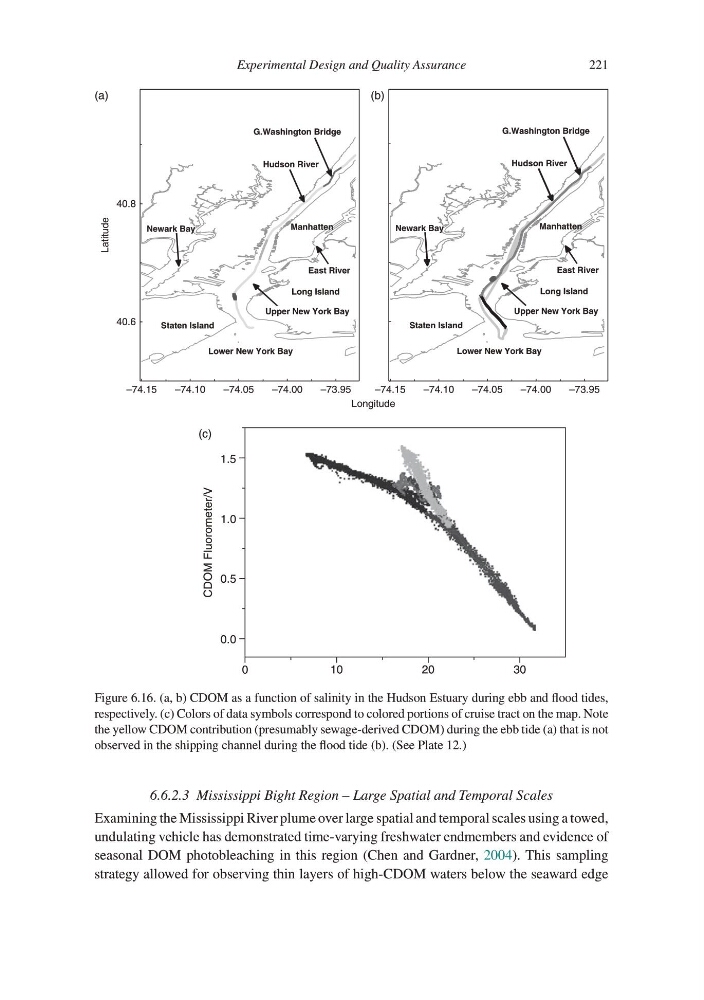
Figure 6.16. (a, b) CDOM as a function of salinity in the Hudson Estuary during ebb and flood tides,
respectively. (c) Colors of data symbols correspond to colored portions of cruise tract on the map. Note
the yellow CDOM contribution (presumably sewage-derived CDOM) during the ebb tide (a) that is not
observed in the shipping channel during the flood tide (b). (See Plate 12.)
221
6.6.2.3 Mississippi Bight Region – Large Spatial and Temporal Scales
Examining the Mississippi River plume over large spatial and temporal scales using a towed,
undulating vehicle has demonstrated time-varying freshwater endmembers and evidence of
seasonal DOM photobleaching in this region (Chen and Gardner, 2004). This sampling
strategy allowed for observing thin layers of high-CDOM waters below the seaward edge
–74.15
–74.10
–74.05
–74.00
–73.95
–74.15
–74.10
–74.05
–74.00
–73.95
40.6
40.8
(a)
(b)
(c)
G.Washington Bridge
Manhatten
Upper New York Bay
Lower New York Bay
Newark Bay
Hudson River
Staten Island
Long Island
East River
Longitude
Latitude
G.Washington Bridge
Manhatten
Upper New York Bay
Lower New York Bay
Newark Bay
Hudson River
Staten Island
Long Island
East River
0
0.0
0.5
1.0
CDOM Fluorometer/V
1.5
10
20
30
Figure 6.16. (a, b) CDOM as a function of salinity in the Hudson Estuary during ebb and flood tides,
respectively. (c) Colors of data symbols correspond to colored portions of cruise tract on the map. Note
the yellow CDOM contribution (presumably sewage-derived CDOM) during the ebb tide (a) that is not
observed in the shipping channel during the flood tide (b). (See Plate 12.)