

Conmy, Del Castillo, Downing, and Chen
212
a laboratory whereby a sensor measures unfiltered and filtered water samples and the difference in signal is calculated.
6.5.1.2 Bubbles
Similar to particles, the presence of bubbles in the water column can also interfere with
fluorescence measurements, resulting in an increase or decrease in signal output. Bubbles
formed naturally due to wave processes in oceans and estuaries or due to flowing water
within streams cannot be avoided when using open-faced sensors. To ensure that these
effects are minimized, ancillary data for river flow, currents or sea surface roughness can be
used to validate such interferences within a data stream. To minimize bubbles within flowthrough sensors, deploying with degassing Y fittings (Twardowski et al., 1999), mounting
of the sensor in a vertical orientation and monitoring the flow rate can all help to remove
bubbles from in-line water flows. In addition, if using a vertical profiling platform, the sensor can be lowered to 1 m depth before data collection so as to equilibrate and clear bubbles
from the flow-through line. Analysts should beware that bubbles can accumulate within
sample flow tubes, or on optical windows in both flow-through and open-faced instruments, so instruments should be monitored within specific environments.
6.5.1.3 Dynamic Range
An understanding of DOM concentration range within natural waters is also critical
when choosing a sensor, as systems can have a wide range in fluorescence intensity. To
ensure high data quality, the dynamic range of a sensor must be representative of DOM
30
40
160
160
140
140
120
120
100
100
80
80
60
60
40
40
20
20
0
0
20
10
0
30
40
20
10
2 / 2 4 / 0 8
2 / 2 5 / 0 8
2 / 2 6 / 0 8
0
2/18/08
2/25/08
Dischanrge (m
3
S
–1
)
FDOM (ppb QSE)
3/3/08
Date
3/10/08
Discharge
FDOM (unfiltered)
FDOM (Filtered)
3/17/08
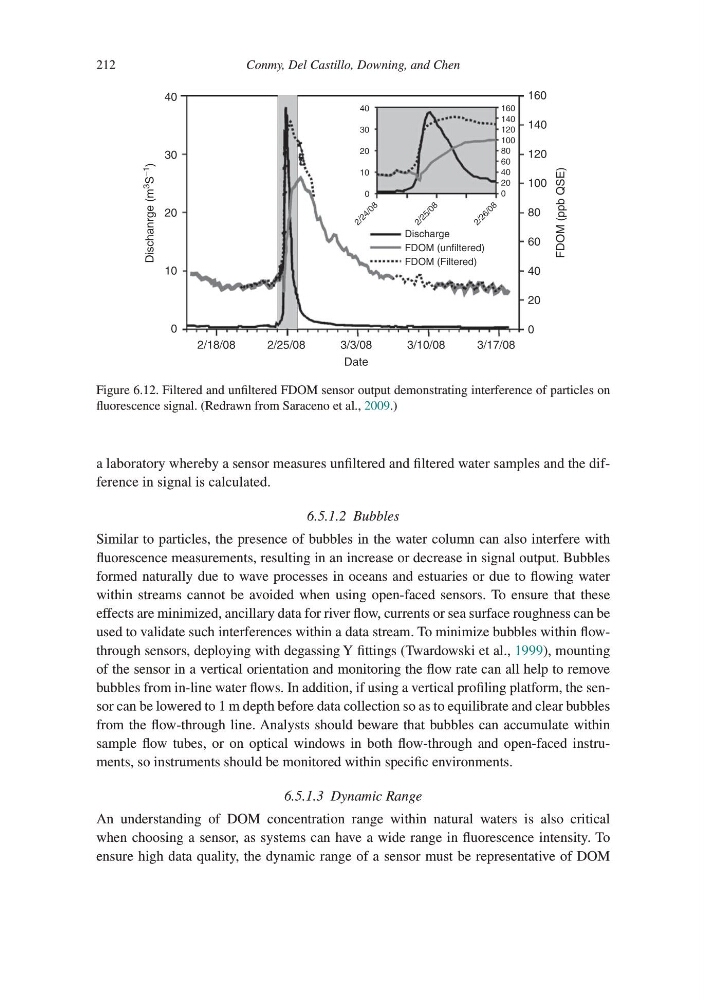
Figure 6.12. Filtered and unfiltered FDOM sensor output demonstrating interference of particles on
fluorescence signal. (Redrawn from Saraceno et al., 2009.)
212
a laboratory whereby a sensor measures unfiltered and filtered water samples and the difference in signal is calculated.
6.5.1.2 Bubbles
Similar to particles, the presence of bubbles in the water column can also interfere with
fluorescence measurements, resulting in an increase or decrease in signal output. Bubbles
formed naturally due to wave processes in oceans and estuaries or due to flowing water
within streams cannot be avoided when using open-faced sensors. To ensure that these
effects are minimized, ancillary data for river flow, currents or sea surface roughness can be
used to validate such interferences within a data stream. To minimize bubbles within flowthrough sensors, deploying with degassing Y fittings (Twardowski et al., 1999), mounting
of the sensor in a vertical orientation and monitoring the flow rate can all help to remove
bubbles from in-line water flows. In addition, if using a vertical profiling platform, the sensor can be lowered to 1 m depth before data collection so as to equilibrate and clear bubbles
from the flow-through line. Analysts should beware that bubbles can accumulate within
sample flow tubes, or on optical windows in both flow-through and open-faced instruments, so instruments should be monitored within specific environments.
6.5.1.3 Dynamic Range
An understanding of DOM concentration range within natural waters is also critical
when choosing a sensor, as systems can have a wide range in fluorescence intensity. To
ensure high data quality, the dynamic range of a sensor must be representative of DOM
30
40
160
160
140
140
120
120
100
100
80
80
60
60
40
40
20
20
0
0
20
10
0
30
40
20
10
2 / 2 4 / 0 8
2 / 2 5 / 0 8
2 / 2 6 / 0 8
0
2/18/08
2/25/08
Dischanrge (m
3
S
–1
)
FDOM (ppb QSE)
3/3/08
Date
3/10/08
Discharge
FDOM (unfiltered)
FDOM (Filtered)
3/17/08
Figure 6.12. Filtered and unfiltered FDOM sensor output demonstrating interference of particles on
fluorescence signal. (Redrawn from Saraceno et al., 2009.)