

Gilchrist and Reynolds
188
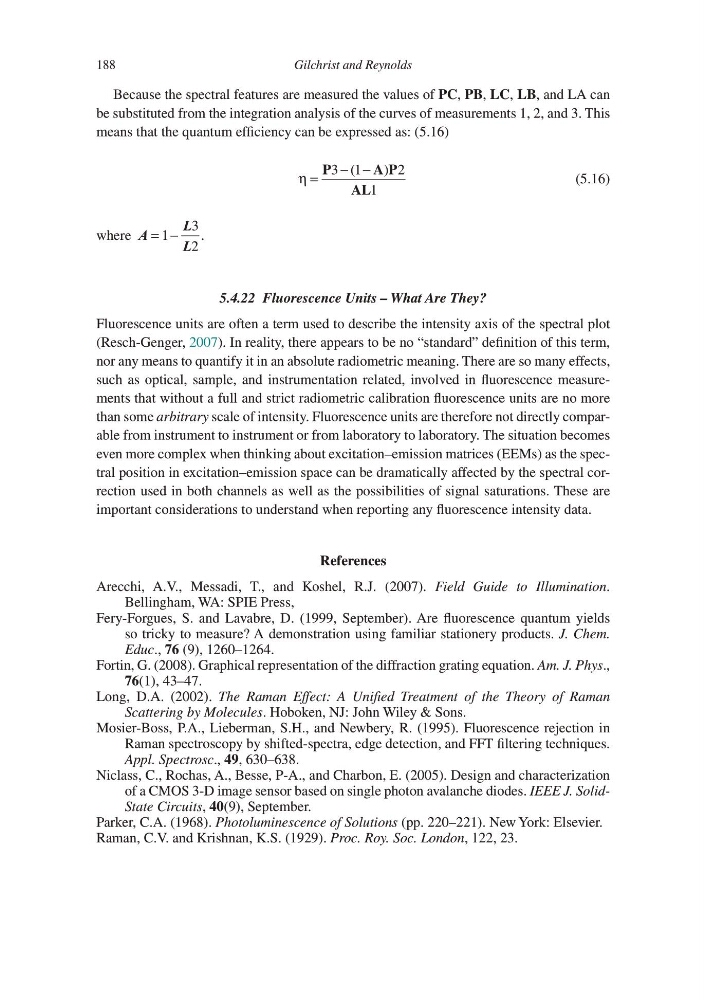
Because the spectral features are measured the values of PC, PB, LC, LB, and LA can
be substituted from the integration analysis of the curves of measurements 1, 2, and 3. This
means that the quantum efficiency can be expressed as: (5.16)
η =
− −
P
AP
AL
3 1
2
1
(
)
(5.16)
where A
L
L
= −
1
3
2
.
5.4.22 Fluorescence Units – What Are They?
Fluorescence units are often a term used to describe the intensity axis of the spectral plot
(Resch-Genger, 2007). In reality, there appears to be no “standard” definition of this term,
nor any means to quantify it in an absolute radiometric meaning. There are so many effects,
such as optical, sample, and instrumentation related, involved in fluorescence measurements that without a full and strict radiometric calibration fluorescence units are no more
than some arbitrary scale of intensity. Fluorescence units are therefore not directly comparable from instrument to instrument or from laboratory to laboratory. The situation becomes
even more complex when thinking about excitation–emission matrices (EEMs) as the spectral position in excitation–emission space can be dramatically affected by the spectral correction used in both channels as well as the possibilities of signal saturations. These are
important considerations to understand when reporting any fluorescence intensity data.
References
Arecchi, A.V., Messadi, T., and Koshel, R.J. (2007). Field Guide to Illumination.
Bellingham, WA: SPIE Press,
Fery-Forgues, S. and Lavabre, D. (1999, September). Are fluorescence quantum yields
so tricky to measure? A demonstration using familiar stationery products. J. Chem.
Educ., 76 (9), 1260–1264.
Fortin, G. (2008). Graphical representation of the diffraction grating equation. Am. J. Phys.,
76(1), 43–47.
Long, D.A. (2002). The Raman Effect: A Unified Treatment of the Theory of Raman
Scattering by Molecules. Hoboken, NJ: John Wiley & Sons.
Mosier-Boss, P.A., Lieberman, S.H., and Newbery, R. (1995). Fluorescence rejection in
Raman spectroscopy by shifted-spectra, edge detection, and FFT filtering techniques.
Appl. Spectrosc., 49, 630–638.
Niclass, C., Rochas, A., Besse, P-A., and Charbon, E. (2005). Design and characterization
of a CMOS 3-D image sensor based on single photon avalanche diodes. IEEE J. SolidState Circuits, 40(9), September.
Parker, C.A. (1968). Photoluminescence of Solutions (pp. 220–221). New York: Elsevier.
Raman, C.V. and Krishnan, K.S. (1929). Proc. Roy. Soc. London, 122, 23.
188
Because the spectral features are measured the values of PC, PB, LC, LB, and LA can
be substituted from the integration analysis of the curves of measurements 1, 2, and 3. This
means that the quantum efficiency can be expressed as: (5.16)
η =
− −
P
AP
AL
3 1
2
1
(
)
(5.16)
where A
L
L
= −
1
3
2
.
5.4.22 Fluorescence Units – What Are They?
Fluorescence units are often a term used to describe the intensity axis of the spectral plot
(Resch-Genger, 2007). In reality, there appears to be no “standard” definition of this term,
nor any means to quantify it in an absolute radiometric meaning. There are so many effects,
such as optical, sample, and instrumentation related, involved in fluorescence measurements that without a full and strict radiometric calibration fluorescence units are no more
than some arbitrary scale of intensity. Fluorescence units are therefore not directly comparable from instrument to instrument or from laboratory to laboratory. The situation becomes
even more complex when thinking about excitation–emission matrices (EEMs) as the spectral position in excitation–emission space can be dramatically affected by the spectral correction used in both channels as well as the possibilities of signal saturations. These are
important considerations to understand when reporting any fluorescence intensity data.
References
Arecchi, A.V., Messadi, T., and Koshel, R.J. (2007). Field Guide to Illumination.
Bellingham, WA: SPIE Press,
Fery-Forgues, S. and Lavabre, D. (1999, September). Are fluorescence quantum yields
so tricky to measure? A demonstration using familiar stationery products. J. Chem.
Educ., 76 (9), 1260–1264.
Fortin, G. (2008). Graphical representation of the diffraction grating equation. Am. J. Phys.,
76(1), 43–47.
Long, D.A. (2002). The Raman Effect: A Unified Treatment of the Theory of Raman
Scattering by Molecules. Hoboken, NJ: John Wiley & Sons.
Mosier-Boss, P.A., Lieberman, S.H., and Newbery, R. (1995). Fluorescence rejection in
Raman spectroscopy by shifted-spectra, edge detection, and FFT filtering techniques.
Appl. Spectrosc., 49, 630–638.
Niclass, C., Rochas, A., Besse, P-A., and Charbon, E. (2005). Design and characterization
of a CMOS 3-D image sensor based on single photon avalanche diodes. IEEE J. SolidState Circuits, 40(9), September.
Parker, C.A. (1968). Photoluminescence of Solutions (pp. 220–221). New York: Elsevier.
Raman, C.V. and Krishnan, K.S. (1929). Proc. Roy. Soc. London, 122, 23.